 3
3peptides
spectra
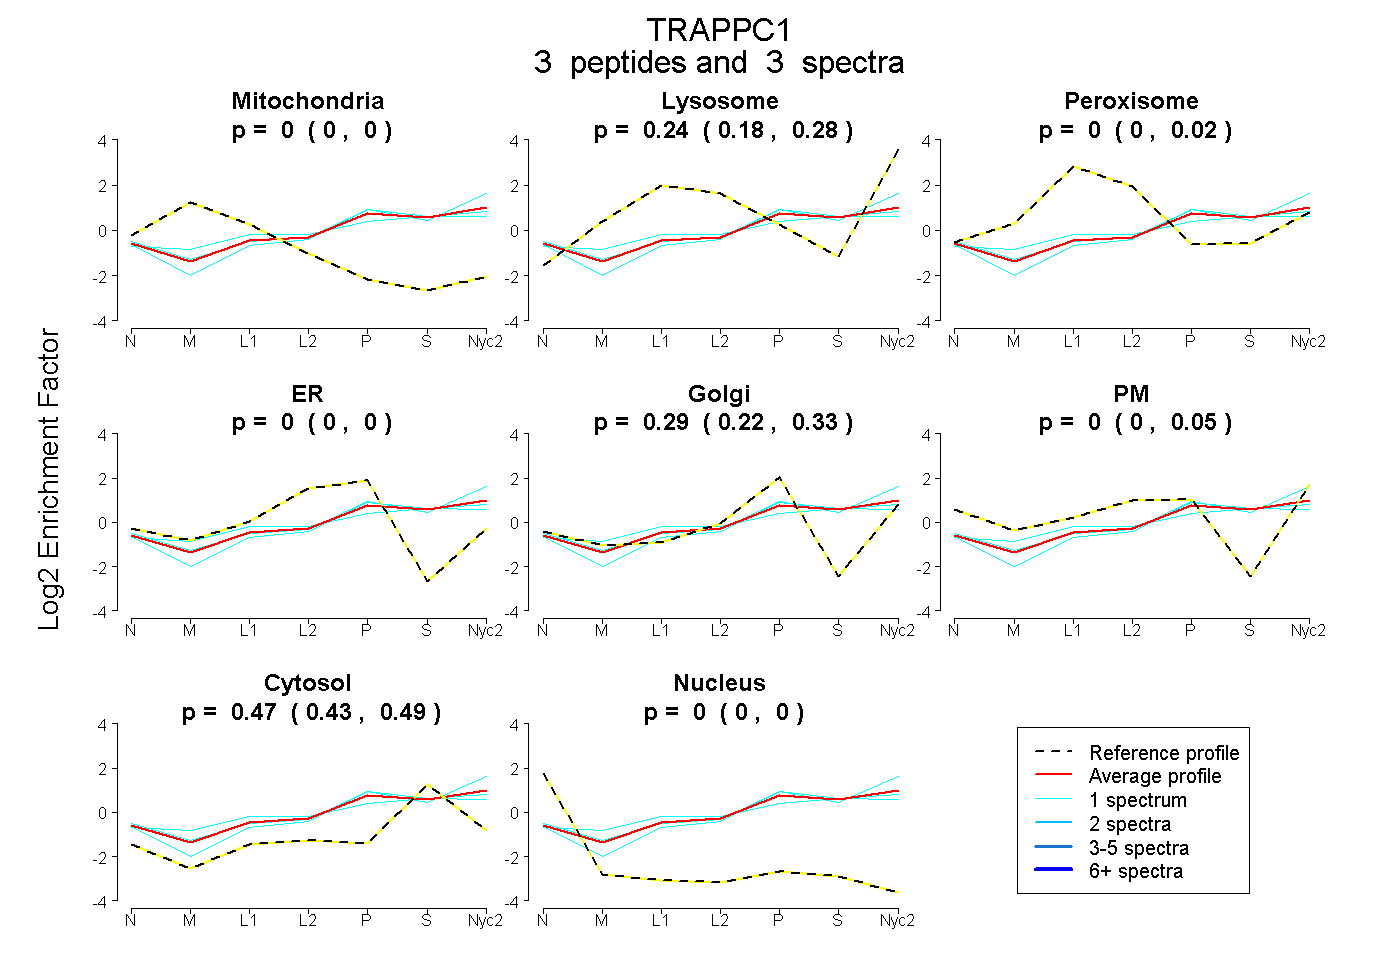
0.000 | 0.000
0.180 | 0.279
0.000 | 0.015
0.000 | 0.000
0.218 | 0.328
0.000 | 0.054
0.432 | 0.494
0.000 | 0.000
| Plot | Mito | Lyso | Perox | ER | Golgi | PM | Cytosol | Nucleus | |||||
| Expt A |
3 peptides |
3 spectra |
|
0.000 0.000 | 0.000 |
0.243 0.180 | 0.279 |
0.000 0.000 | 0.015 |
0.000 0.000 | 0.000 |
0.291 0.218 | 0.328 |
0.000 0.000 | 0.054 |
0.466 0.432 | 0.494 |
0.000 0.000 | 0.000 |
| 1 spectrum, TVHNLYLFDR | 0.000 | 0.177 | 0.137 | 0.000 | 0.222 | 0.000 | 0.465 | 0.000 | ||
| 1 spectrum, DGFLSFQTSR | 0.000 | 0.151 | 0.000 | 0.000 | 0.342 | 0.000 | 0.507 | 0.000 | ||
| 1 spectrum, SLPFFSAR | 0.000 | 0.285 | 0.000 | 0.000 | 0.322 | 0.000 | 0.393 | 0.000 |
| Plot | Mito | Lyso or Perox | ER | Golgi | PM | Cytosol | Nucleus | ||||||
| Expt B |
1 peptide |
2 spectra |
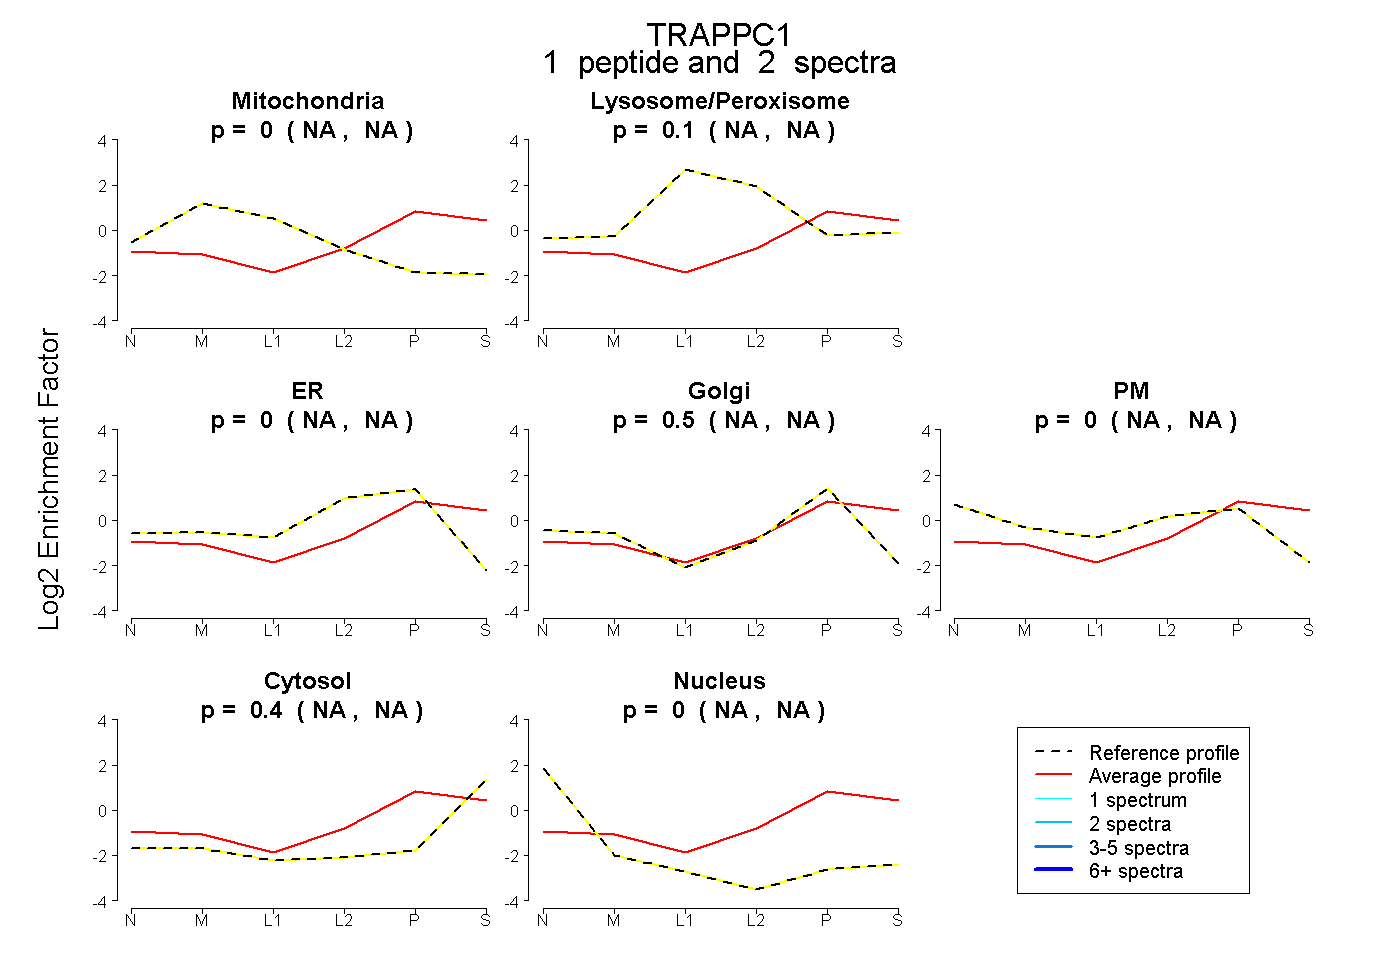 |
0.000 NA | NA |
0.100 NA | NA |
0.000 NA | NA |
0.503 NA | NA |
0.000 NA | NA |
0.397 NA | NA |
0.000 NA | NA |
|||
| Plot | Lyso | Other | |||||||||||
| Expt C |
1 peptide |
5 spectra |
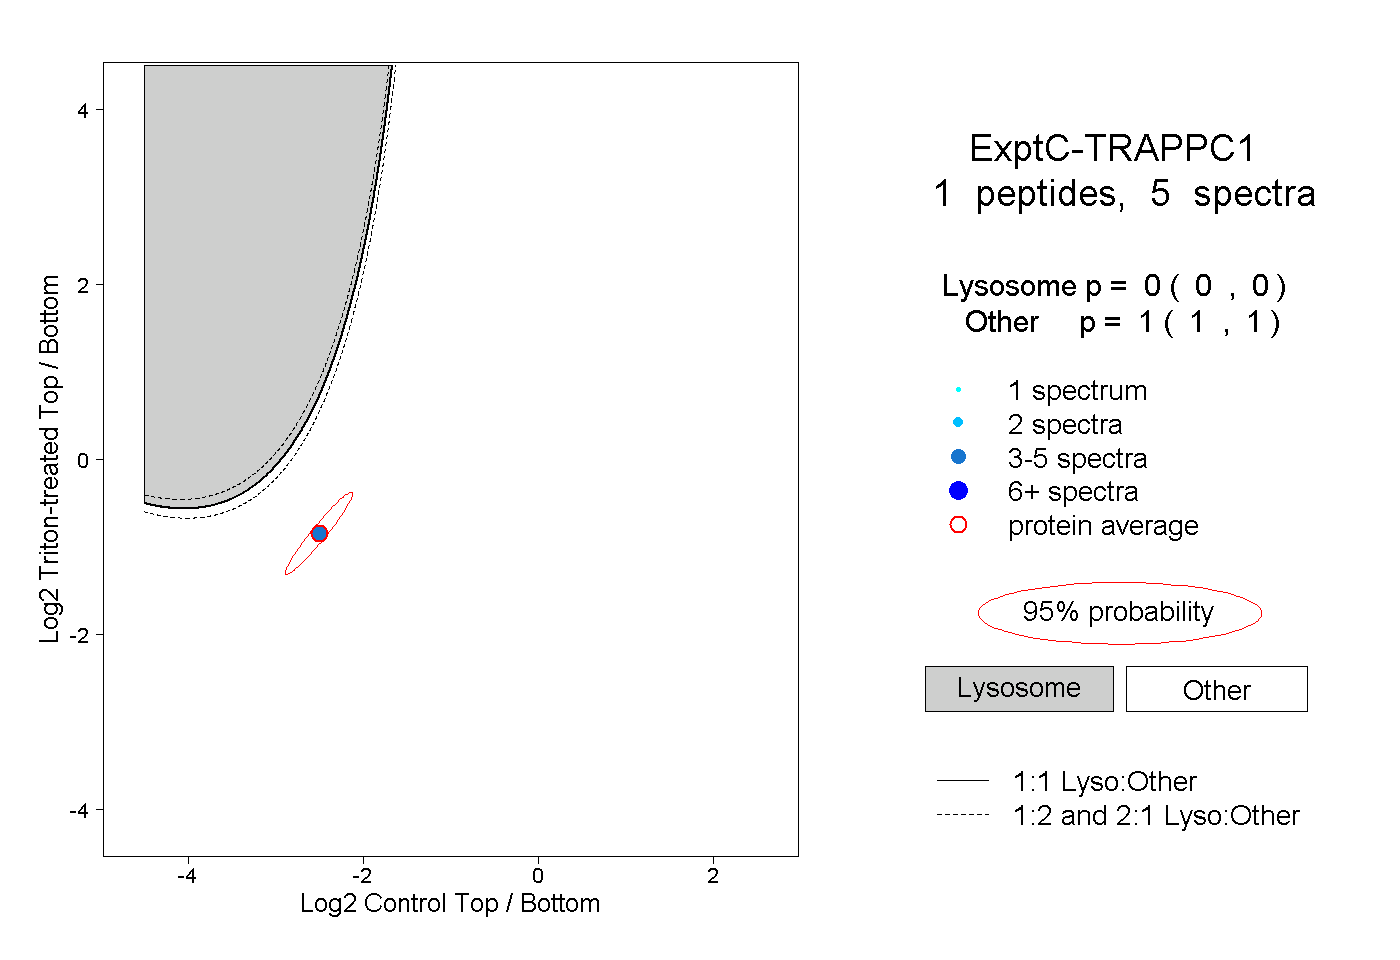 |
0.000 0.000 | 0.000 |
1.000 1.000 | 1.000 |