 21
21peptides
spectra
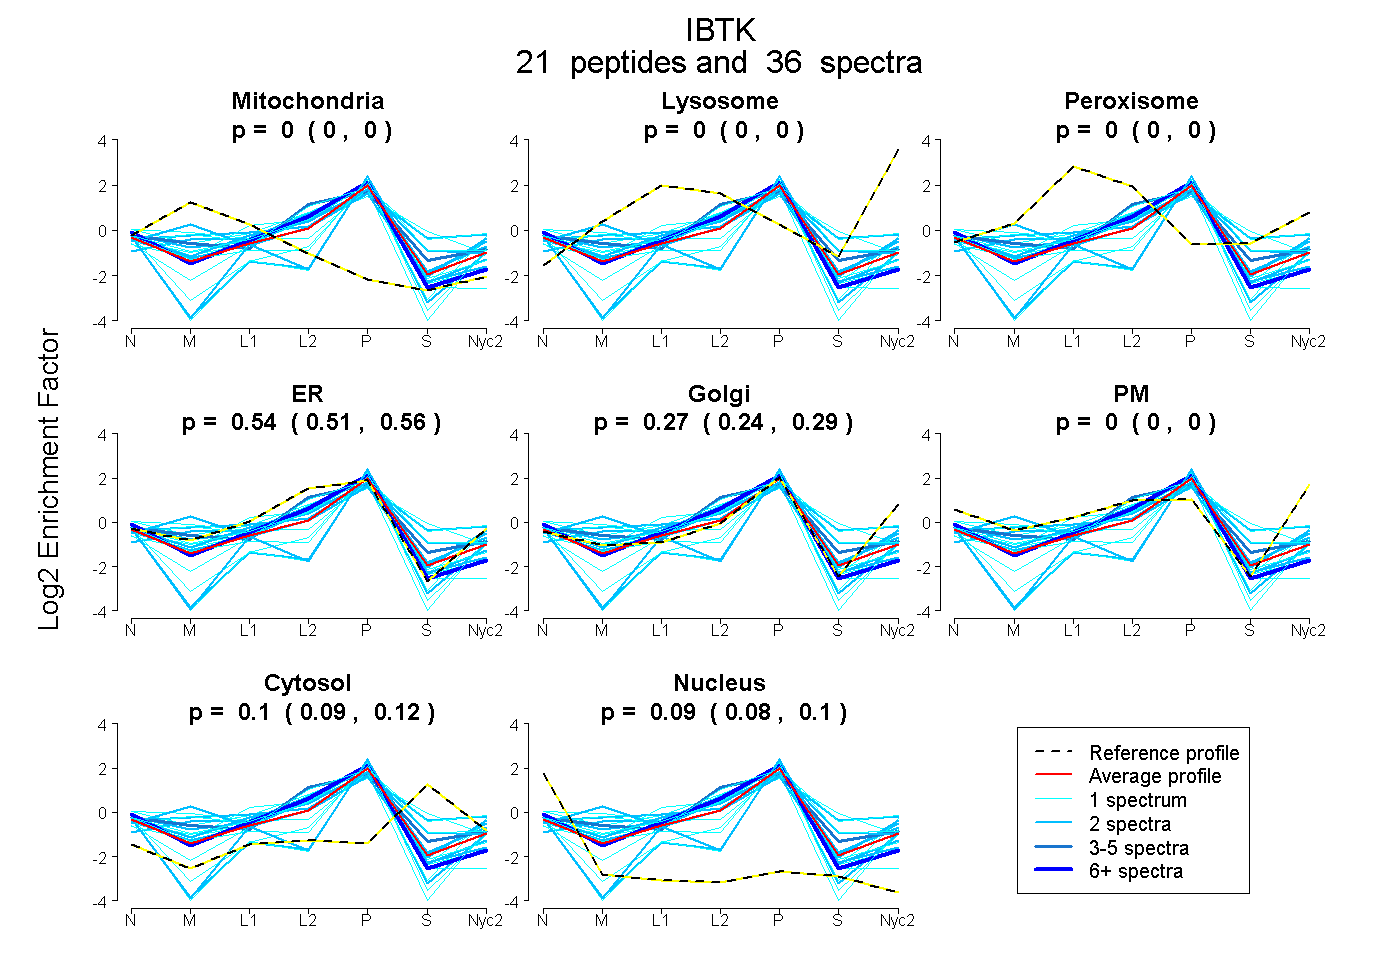
0.000 | 0.000
0.000 | 0.000
0.000 | 0.000
0.515 | 0.559
0.240 | 0.288
0.000 | 0.000
0.091 | 0.116
0.083 | 0.098
3peptides
spectra
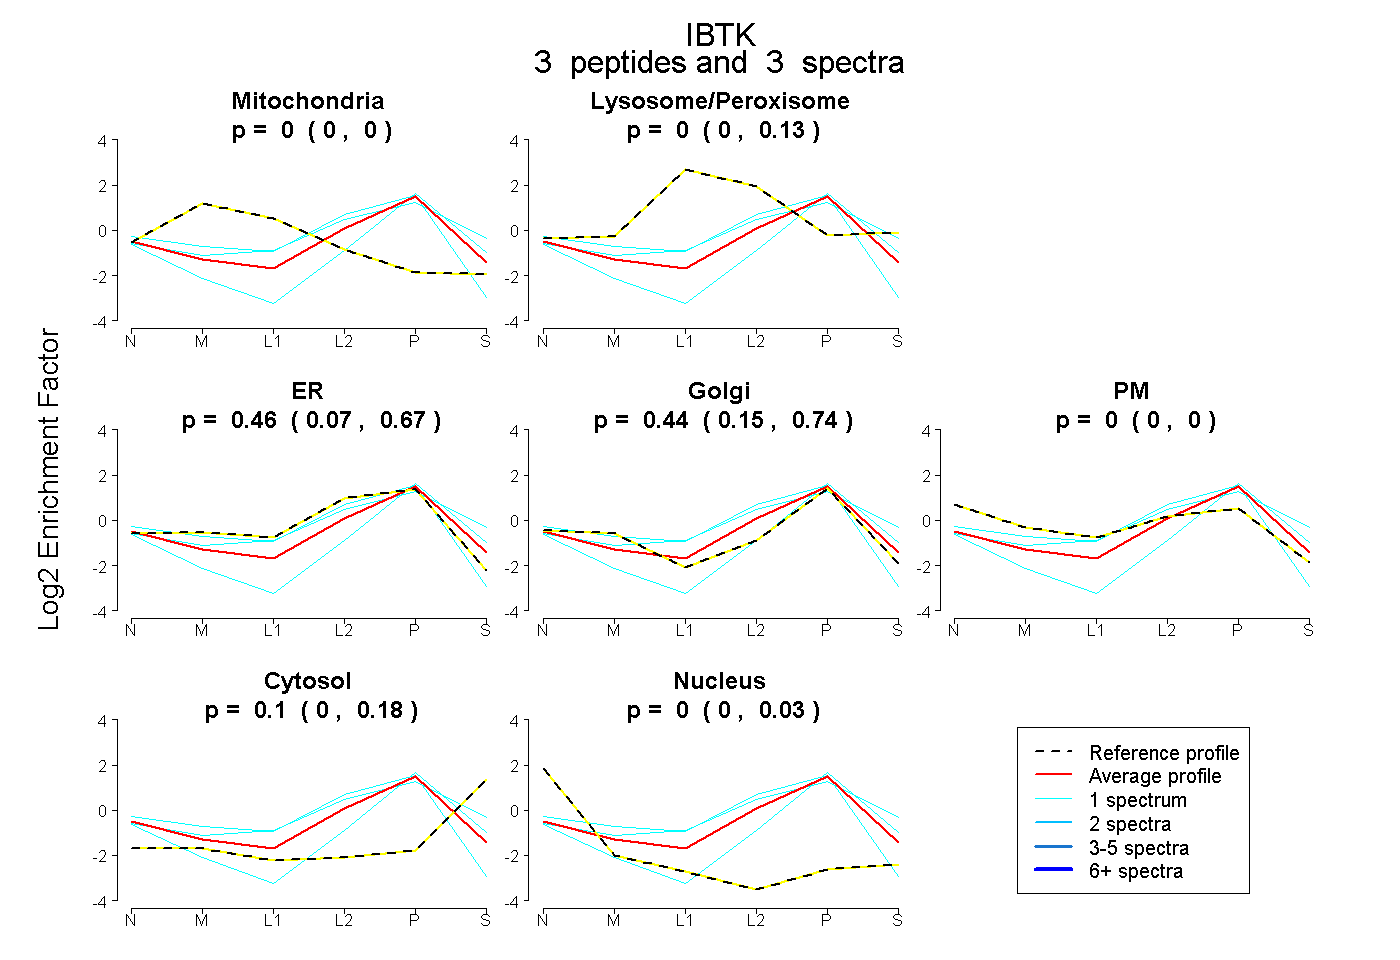
0.000 | 0.000
0.000 | 0.131
0.067 | 0.665
0.151 | 0.740
0.000 | 0.000
0.000 | 0.181
0.000 | 0.028
9peptides
spectra
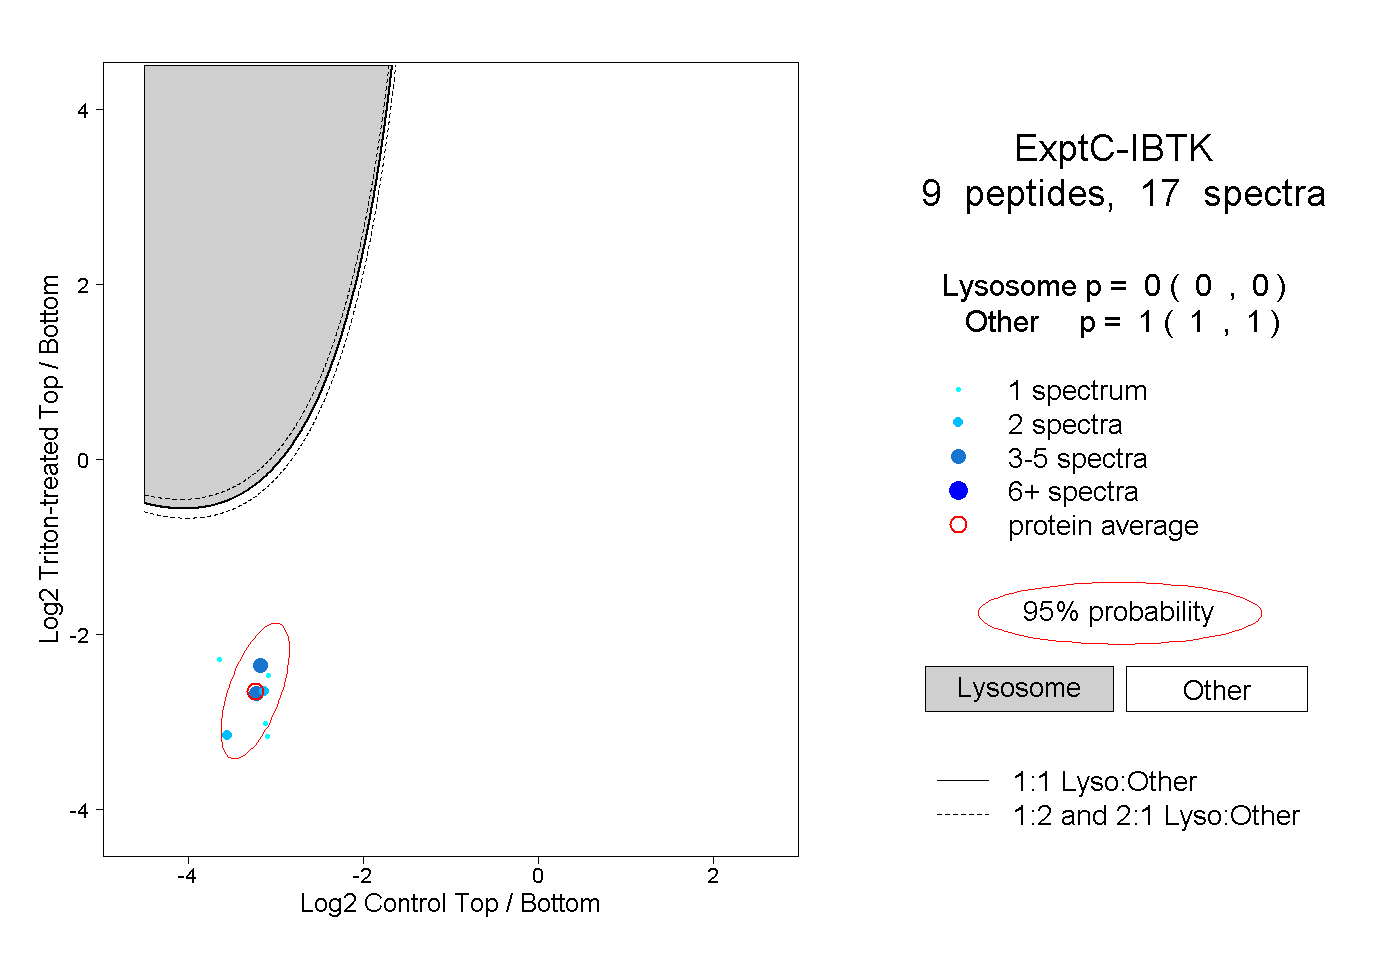
0.000 | 0.000
1.000 | 1.000
2peptides
spectra
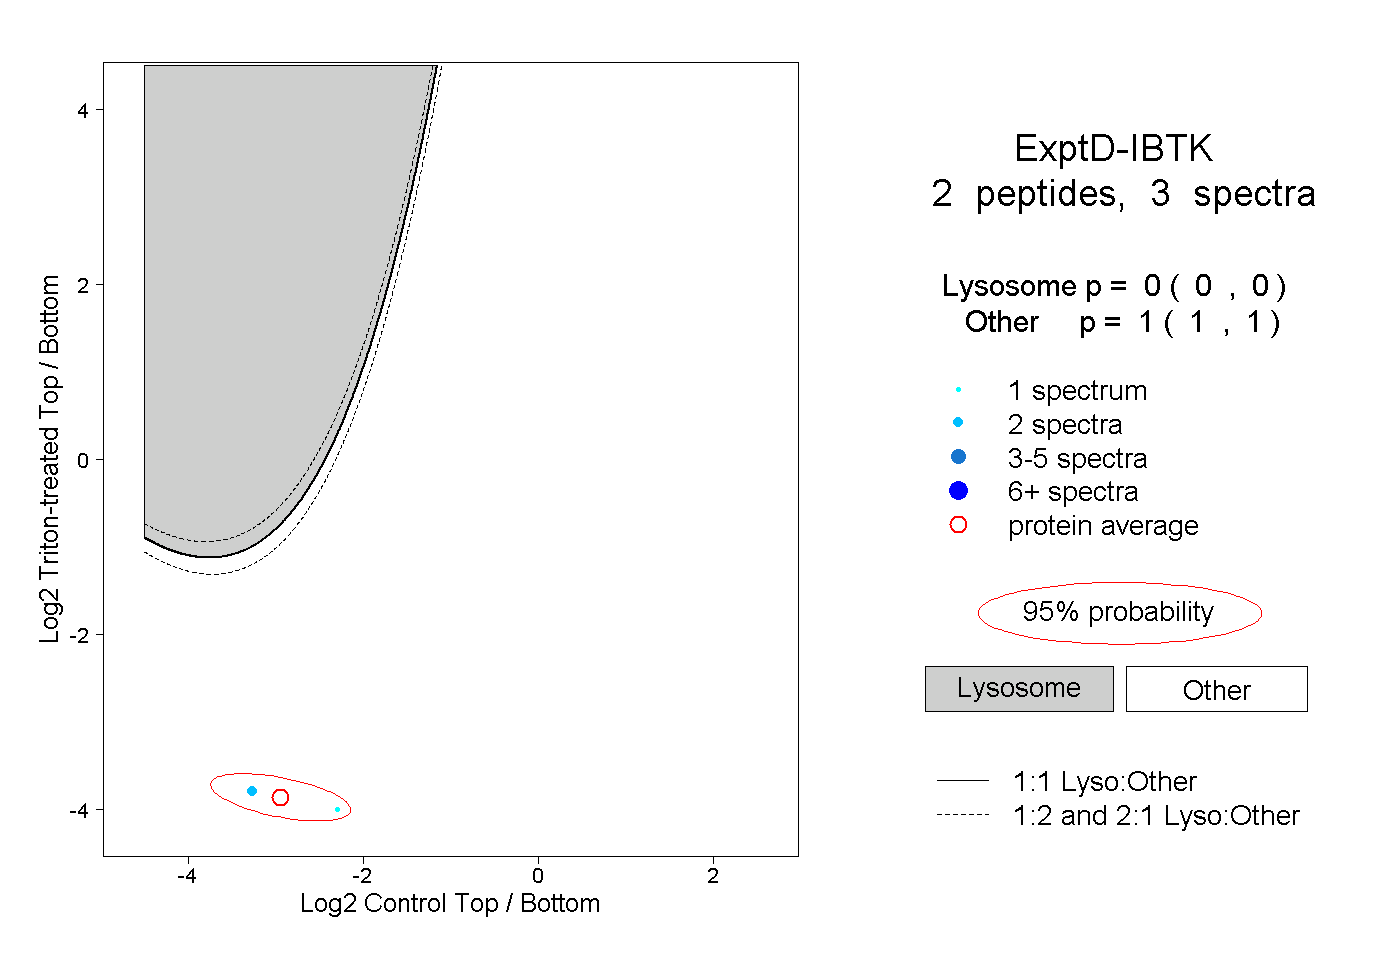
0.000 | 0.000
1.000 | 1.000