 21
21peptides
spectra
0.000 | 0.000
0.000 | 0.000
0.000 | 0.000
0.515 | 0.559
0.240 | 0.288
0.000 | 0.000
0.091 | 0.116
0.083 | 0.098
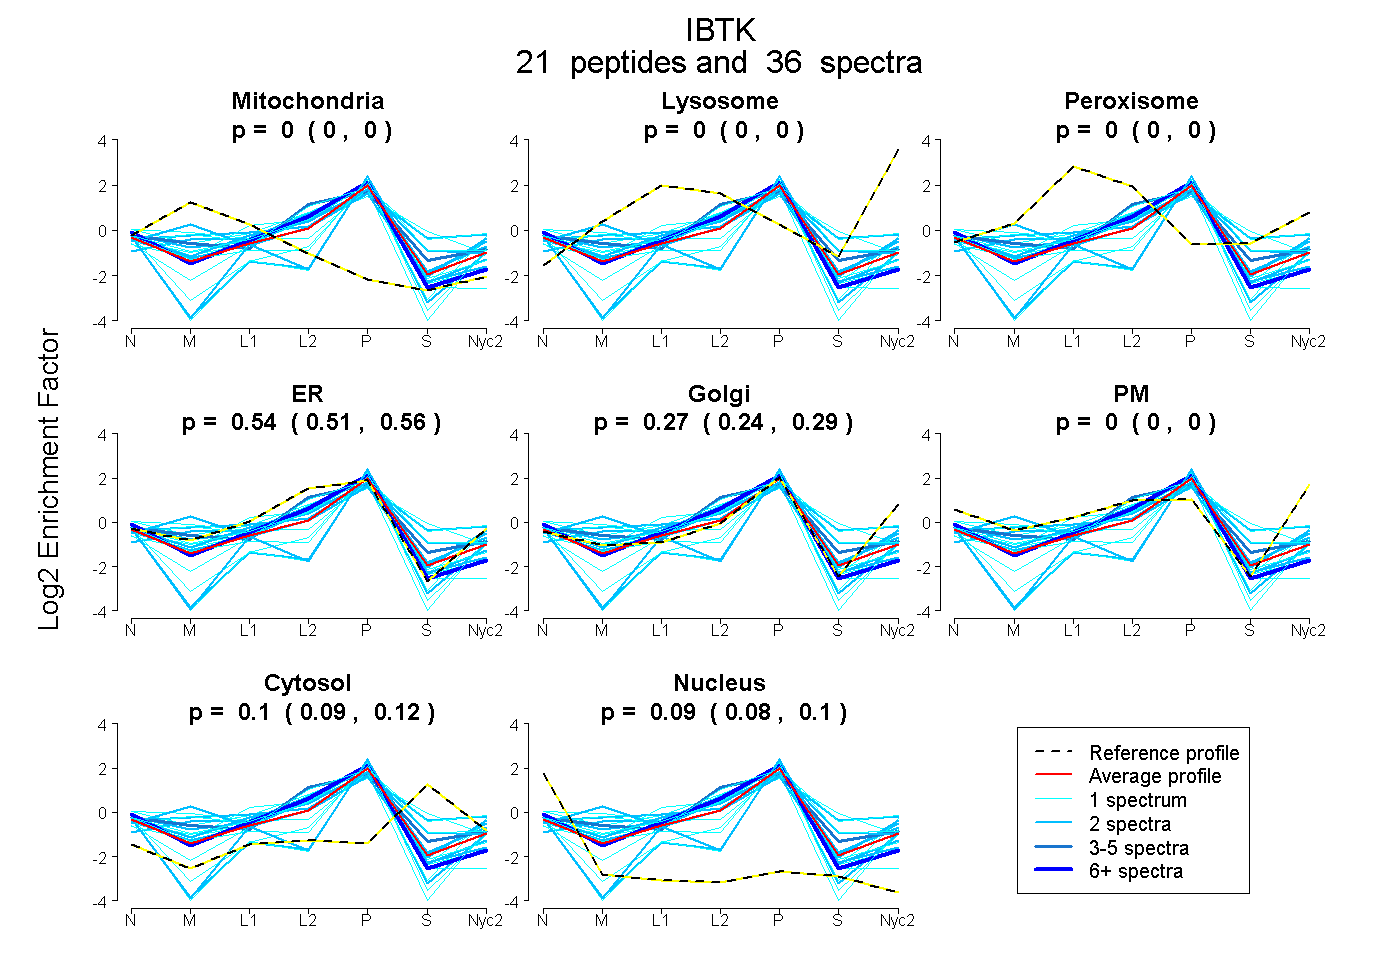
| Plot | Mito | Lyso | Perox | ER | Golgi | PM | Cytosol | Nucleus | |||||
| Expt A |
21 peptides |
36 spectra |
|
0.000 0.000 | 0.000 |
0.000 0.000 | 0.000 |
0.000 0.000 | 0.000 |
0.537 0.515 | 0.559 |
0.267 0.240 | 0.288 |
0.000 0.000 | 0.000 |
0.105 0.091 | 0.116 |
0.091 0.083 | 0.098 |
| 1 spectrum, SLDVLSEDVLK | 0.000 | 0.000 | 0.000 | 0.801 | 0.039 | 0.000 | 0.052 | 0.107 | ||
| 2 spectra, EFPCHK | 0.136 | 0.000 | 0.012 | 0.438 | 0.371 | 0.000 | 0.043 | 0.000 | ||
| 2 spectra, DLSIFYR | 0.000 | 0.000 | 0.000 | 0.754 | 0.142 | 0.000 | 0.000 | 0.104 | ||
| 1 spectrum, KPVPGR | 0.000 | 0.000 | 0.000 | 0.000 | 0.643 | 0.000 | 0.039 | 0.318 | ||
| 1 spectrum, EMCEVALAENLTLK | 0.000 | 0.000 | 0.096 | 0.537 | 0.000 | 0.000 | 0.367 | 0.000 | ||
| 1 spectrum, FGLSNLSSR | 0.087 | 0.000 | 0.000 | 0.602 | 0.311 | 0.000 | 0.000 | 0.000 | ||
| 2 spectra, EGLSPLDLLMK | 0.031 | 0.000 | 0.000 | 0.713 | 0.138 | 0.000 | 0.118 | 0.000 | ||
| 3 spectra, HALDVLSVITK | 0.000 | 0.000 | 0.000 | 0.803 | 0.000 | 0.000 | 0.197 | 0.000 | ||
| 2 spectra, LFPAHK | 0.261 | 0.000 | 0.000 | 0.436 | 0.292 | 0.000 | 0.000 | 0.012 | ||
| 1 spectrum, NFLLEEK | 0.000 | 0.000 | 0.000 | 0.223 | 0.603 | 0.000 | 0.000 | 0.174 | ||
| 2 spectra, SAPQFIPSSR | 0.000 | 0.000 | 0.000 | 0.000 | 0.663 | 0.000 | 0.069 | 0.269 | ||
| 1 spectrum, QQEAALIR | 0.000 | 0.000 | 0.000 | 0.036 | 0.578 | 0.000 | 0.298 | 0.088 | ||
| 1 spectrum, ICILAMDGAGR | 0.000 | 0.000 | 0.000 | 0.816 | 0.000 | 0.000 | 0.000 | 0.184 | ||
| 1 spectrum, DRPAHVVFK | 0.058 | 0.000 | 0.000 | 0.733 | 0.172 | 0.000 | 0.007 | 0.031 | ||
| 2 spectra, LEYFHSMLSR | 0.000 | 0.000 | 0.000 | 0.708 | 0.000 | 0.000 | 0.292 | 0.000 | ||
| 1 spectrum, NEILFVTQDGEGFK | 0.000 | 0.000 | 0.000 | 0.582 | 0.090 | 0.000 | 0.328 | 0.000 | ||
| 1 spectrum, IISHGIK | 0.185 | 0.000 | 0.000 | 0.381 | 0.385 | 0.000 | 0.000 | 0.049 | ||
| 6 spectra, LPFAHR | 0.000 | 0.000 | 0.000 | 0.840 | 0.000 | 0.000 | 0.000 | 0.160 | ||
| 2 spectra, GTENSPALNVAR | 0.000 | 0.000 | 0.000 | 0.000 | 0.708 | 0.000 | 0.104 | 0.188 | ||
| 1 spectrum, GVGEDDPVK | 0.000 | 0.000 | 0.000 | 0.671 | 0.037 | 0.000 | 0.291 | 0.000 | ||
| 2 spectra, HHPELLDLFSR | 0.000 | 0.006 | 0.013 | 0.463 | 0.197 | 0.000 | 0.321 | 0.000 |
| Plot | Mito | Lyso or Perox | ER | Golgi | PM | Cytosol | Nucleus | ||||||
| Expt B |
3 peptides |
3 spectra |
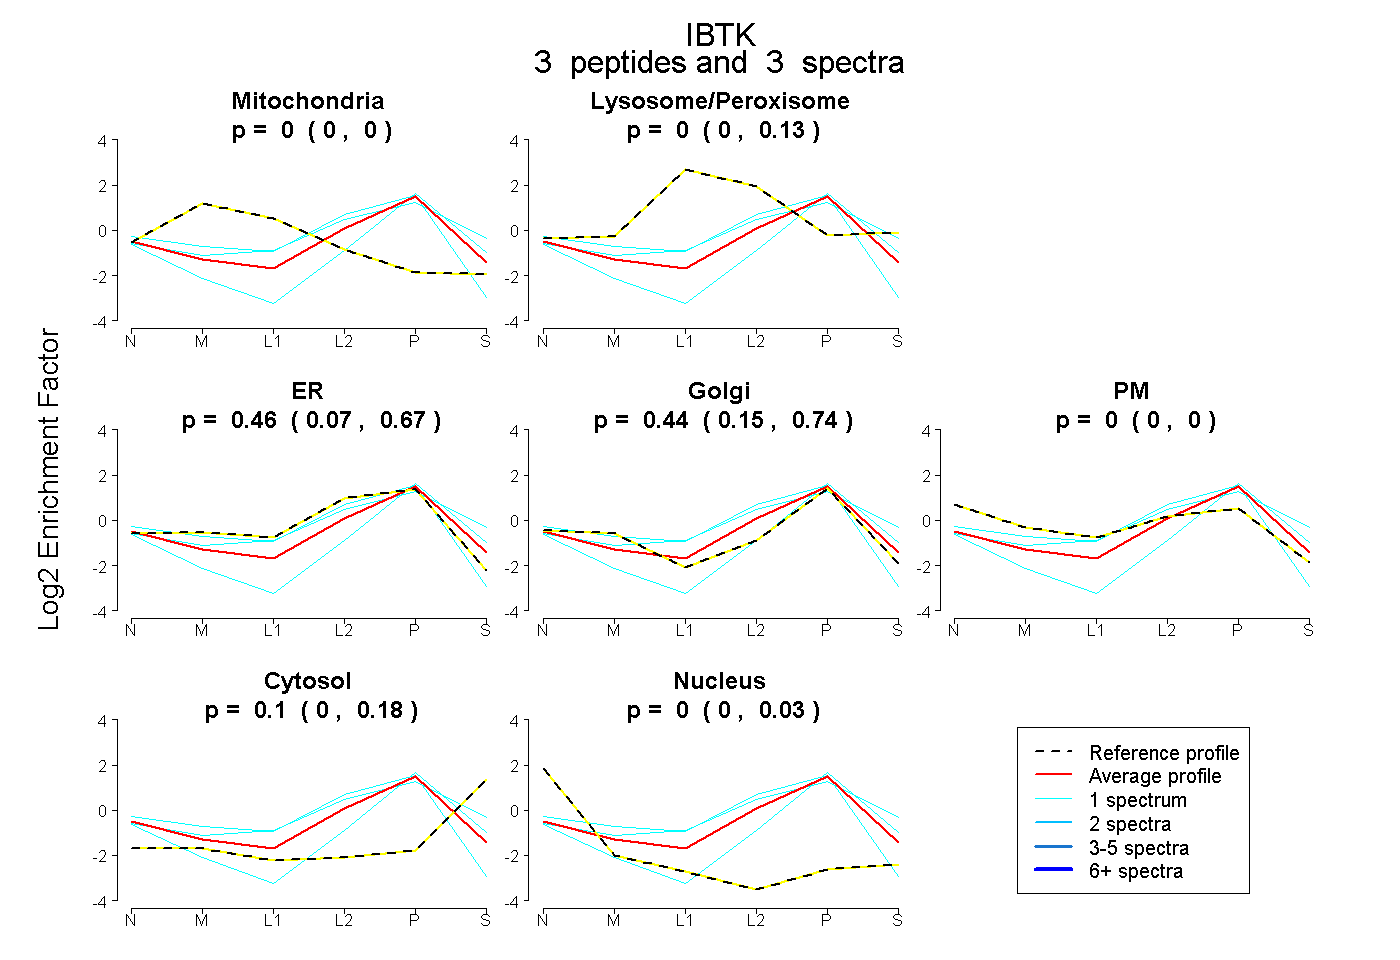 |
0.000 0.000 | 0.000 |
0.000 0.000 | 0.131 |
0.461 0.067 | 0.665 |
0.441 0.151 | 0.740 |
0.000 0.000 | 0.000 |
0.099 0.000 | 0.181 |
0.000 0.000 | 0.028 |
|||
| Plot | Lyso | Other | |||||||||||
| Expt C |
9 peptides |
17 spectra |
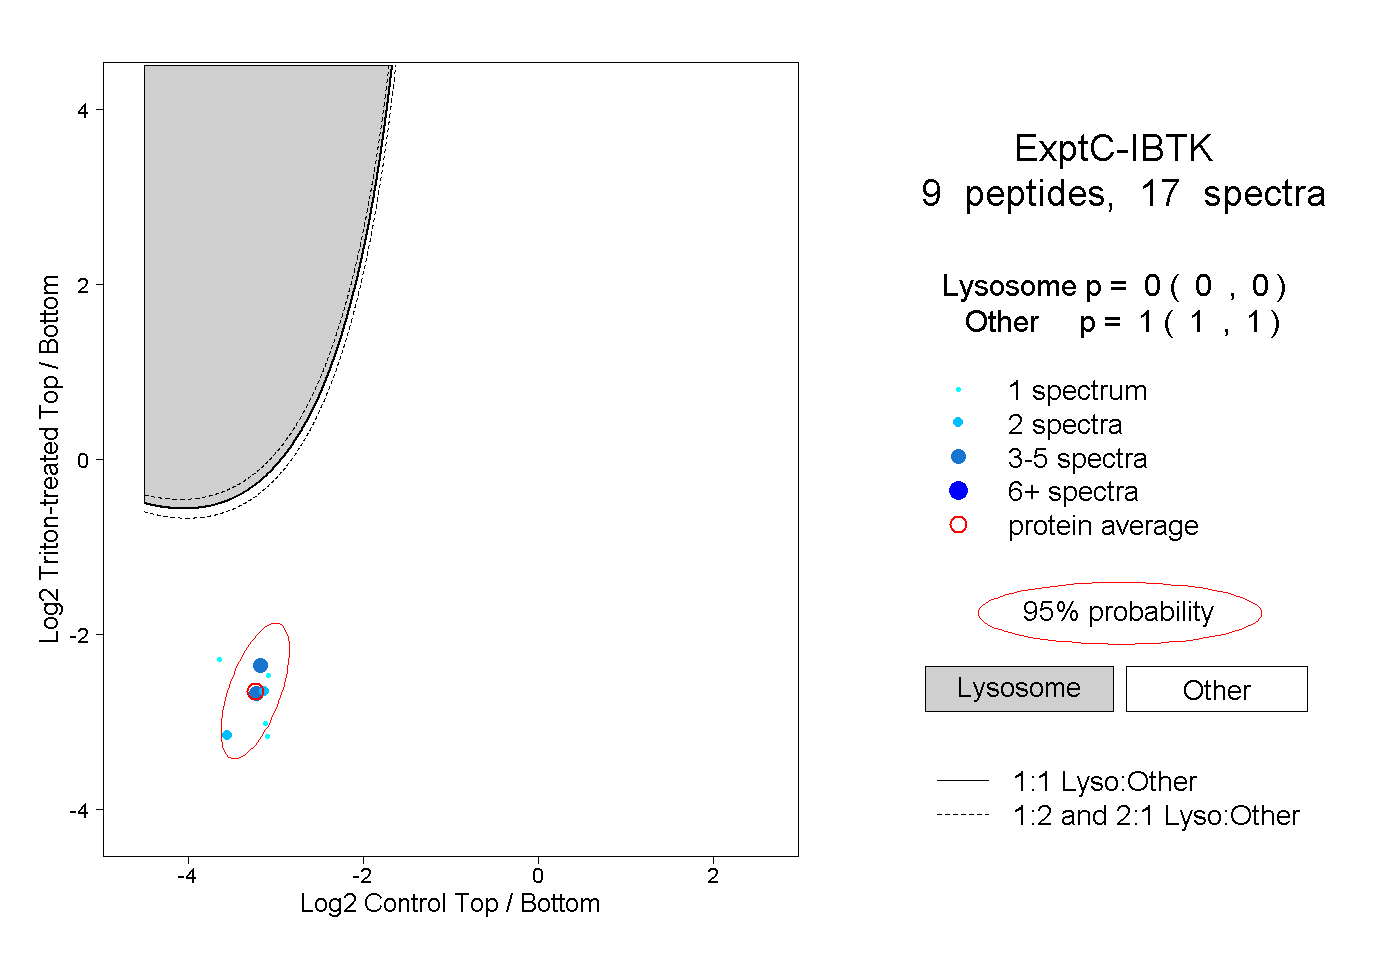 |
0.000 0.000 | 0.000 |
1.000 1.000 | 1.000 |
||||||||
| Plot | Lyso | Other | |||||||||||
| Expt D |
2 peptides |
3 spectra |
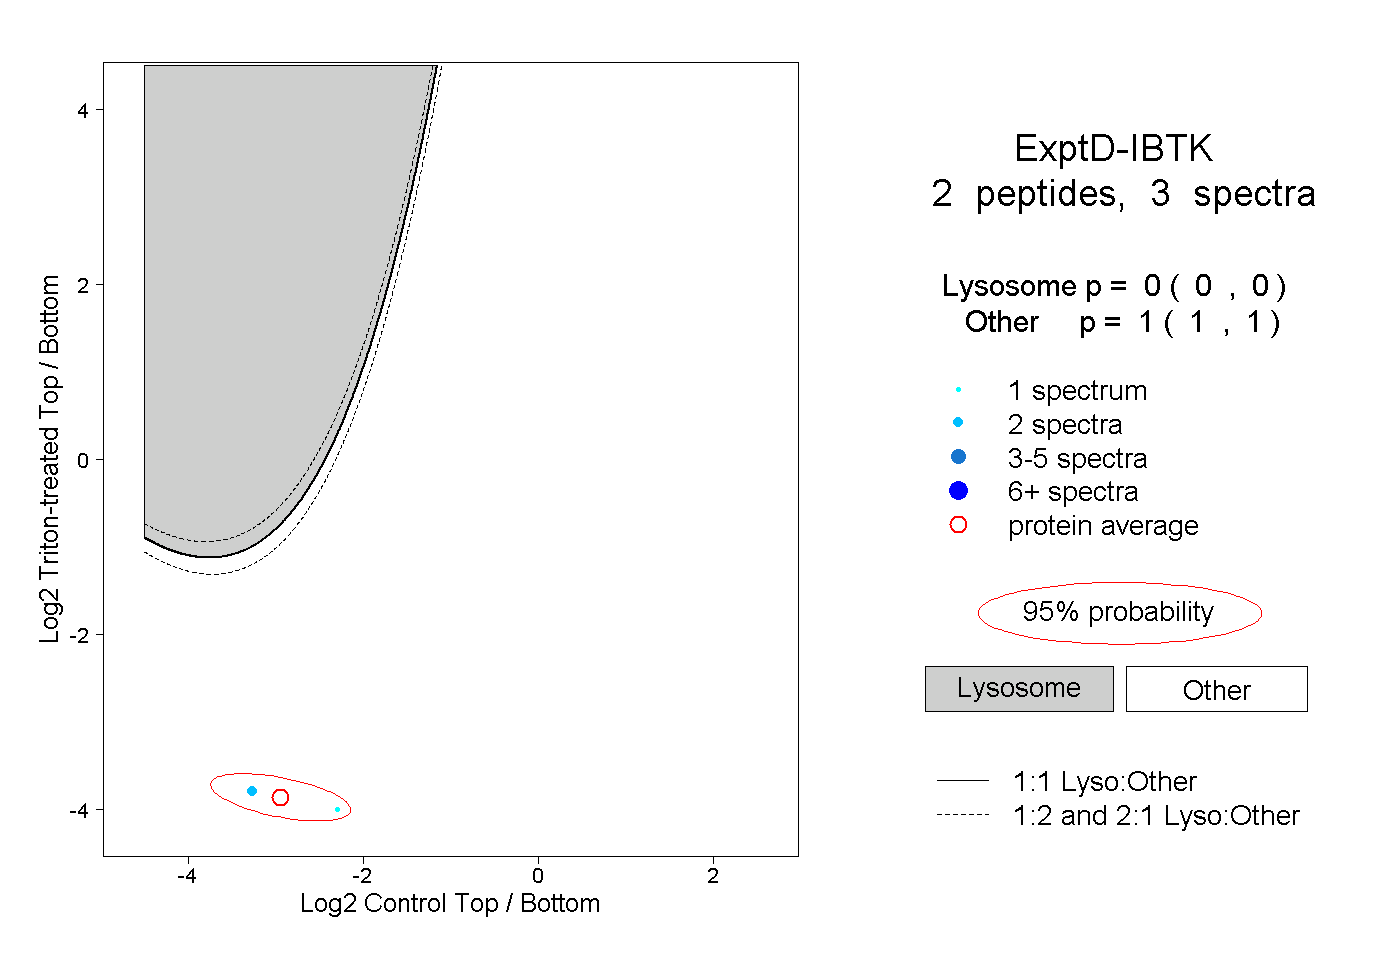 |
0.000 0.000 | 0.000 |
1.000 1.000 | 1.000 |