 3
3peptides
spectra
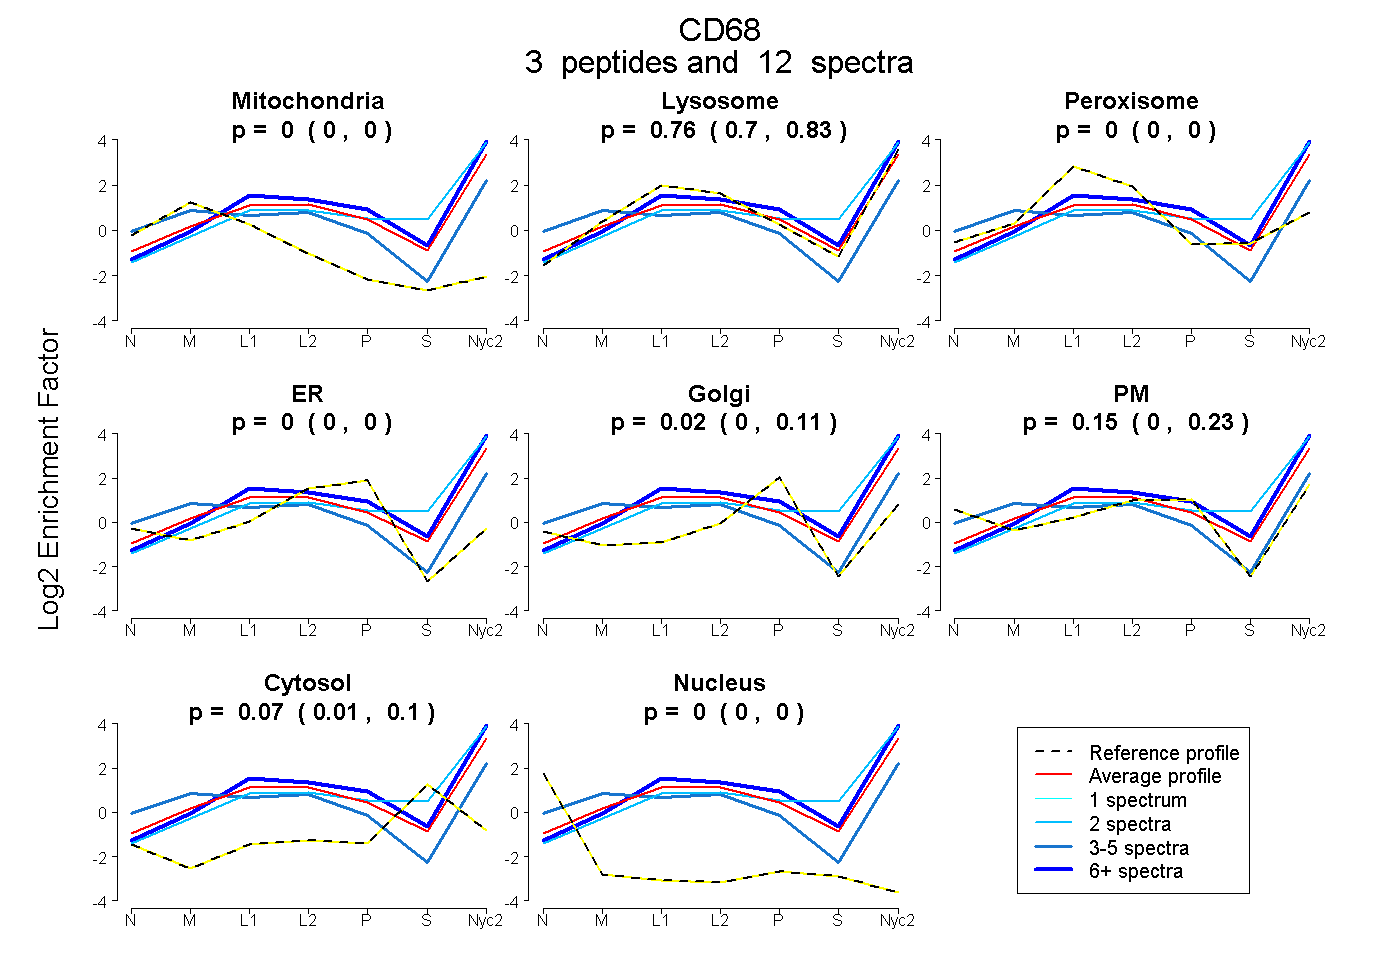
0.000 | 0.000
0.696 | 0.831
0.000 | 0.000
0.000 | 0.000
0.000 | 0.110
0.000 | 0.229
0.010 | 0.103
0.000 | 0.000
1peptide
spectrum
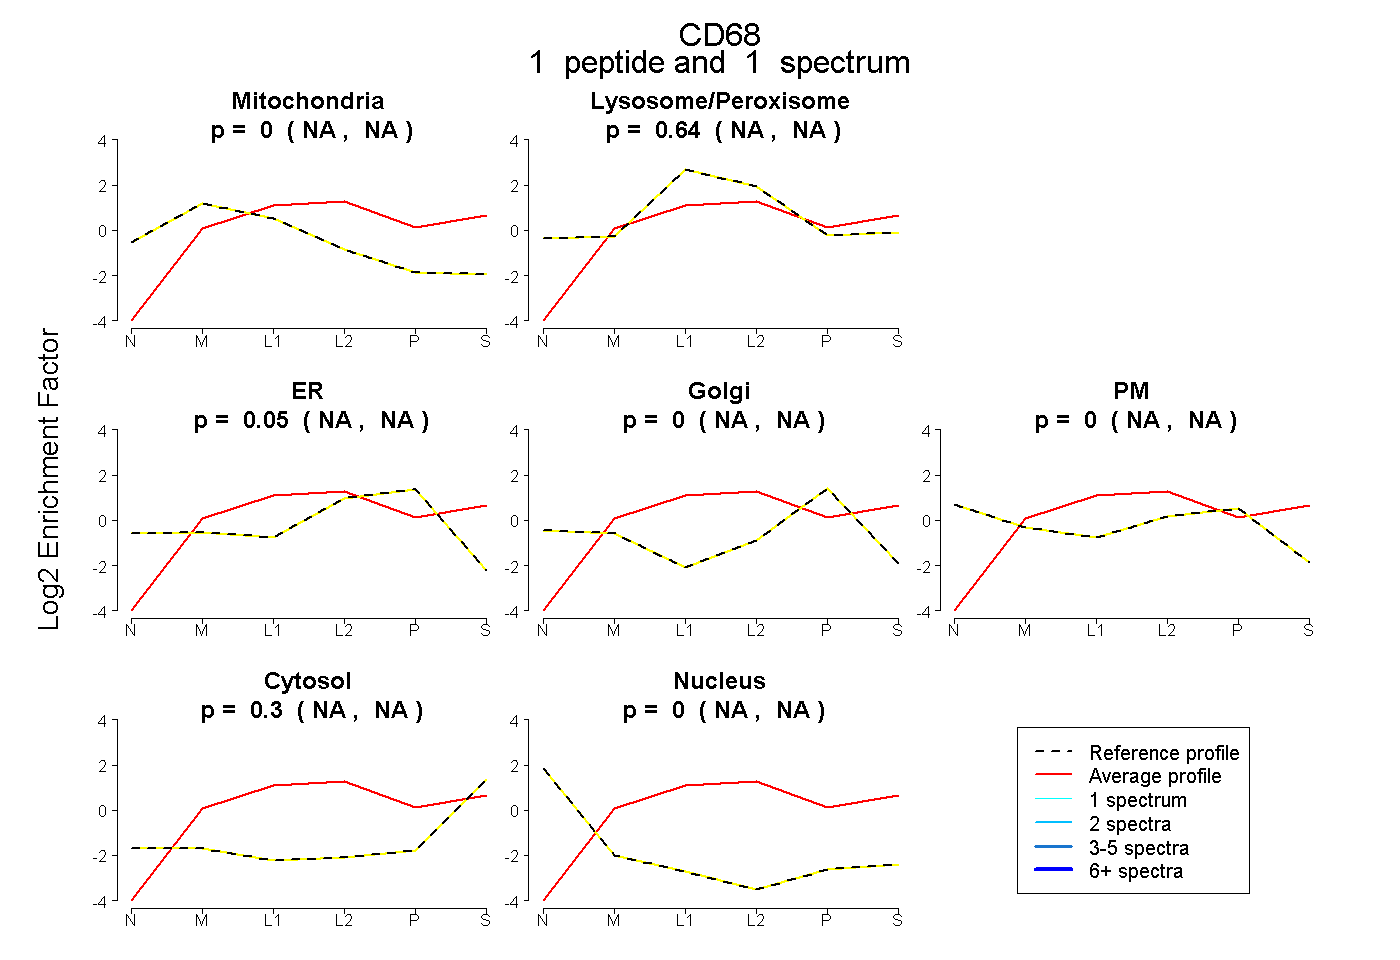
NA | NA
NA | NA
NA | NA
NA | NA
NA | NA
NA | NA
NA | NA
3peptides
spectra
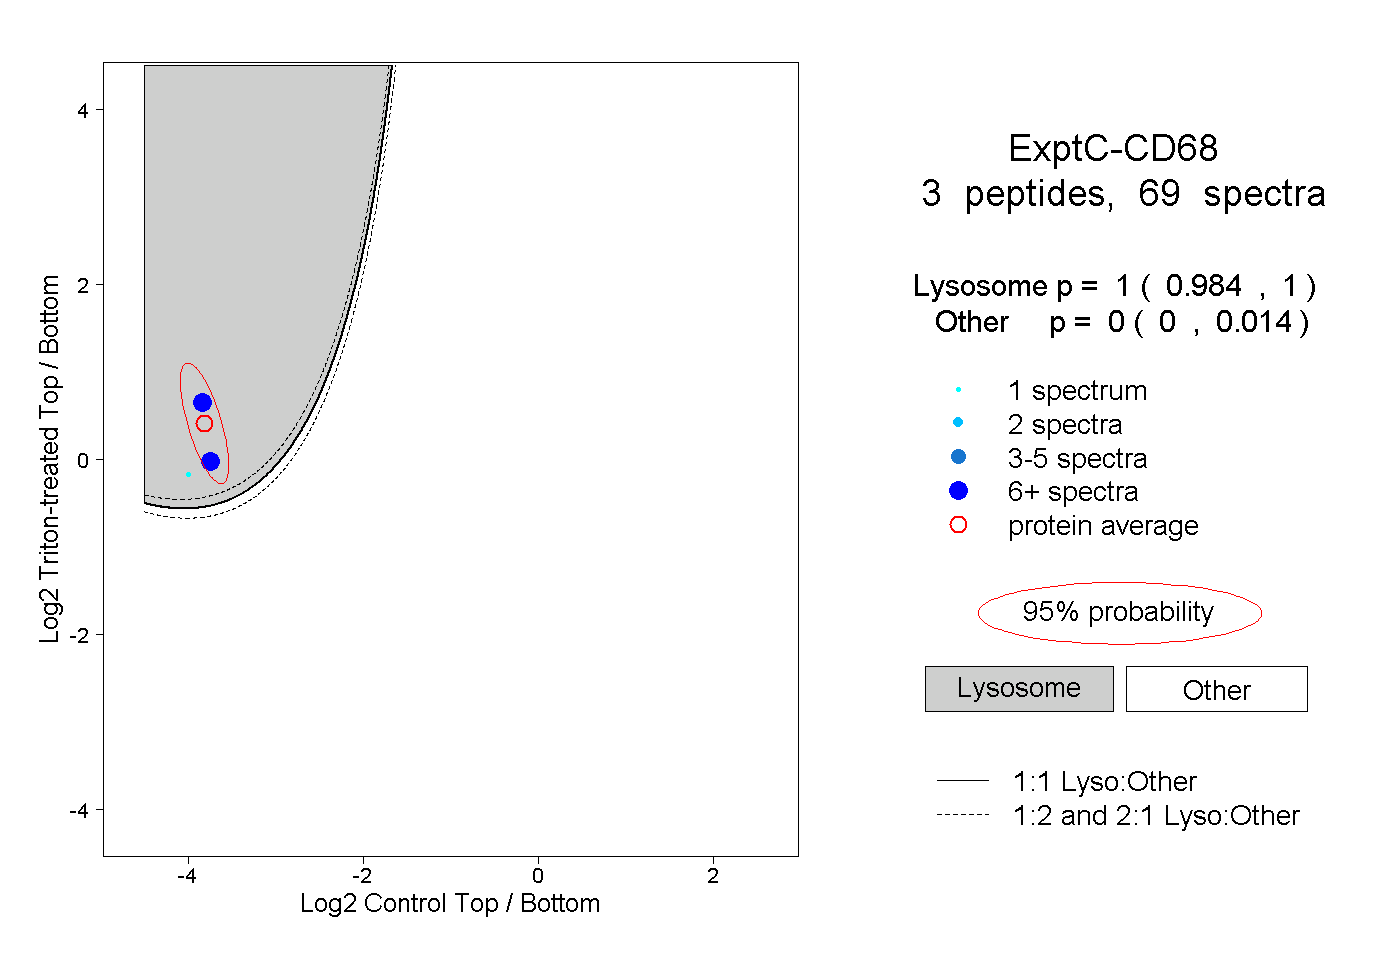
0.984 | 1.000
0.000 | 0.014
2peptides
spectra
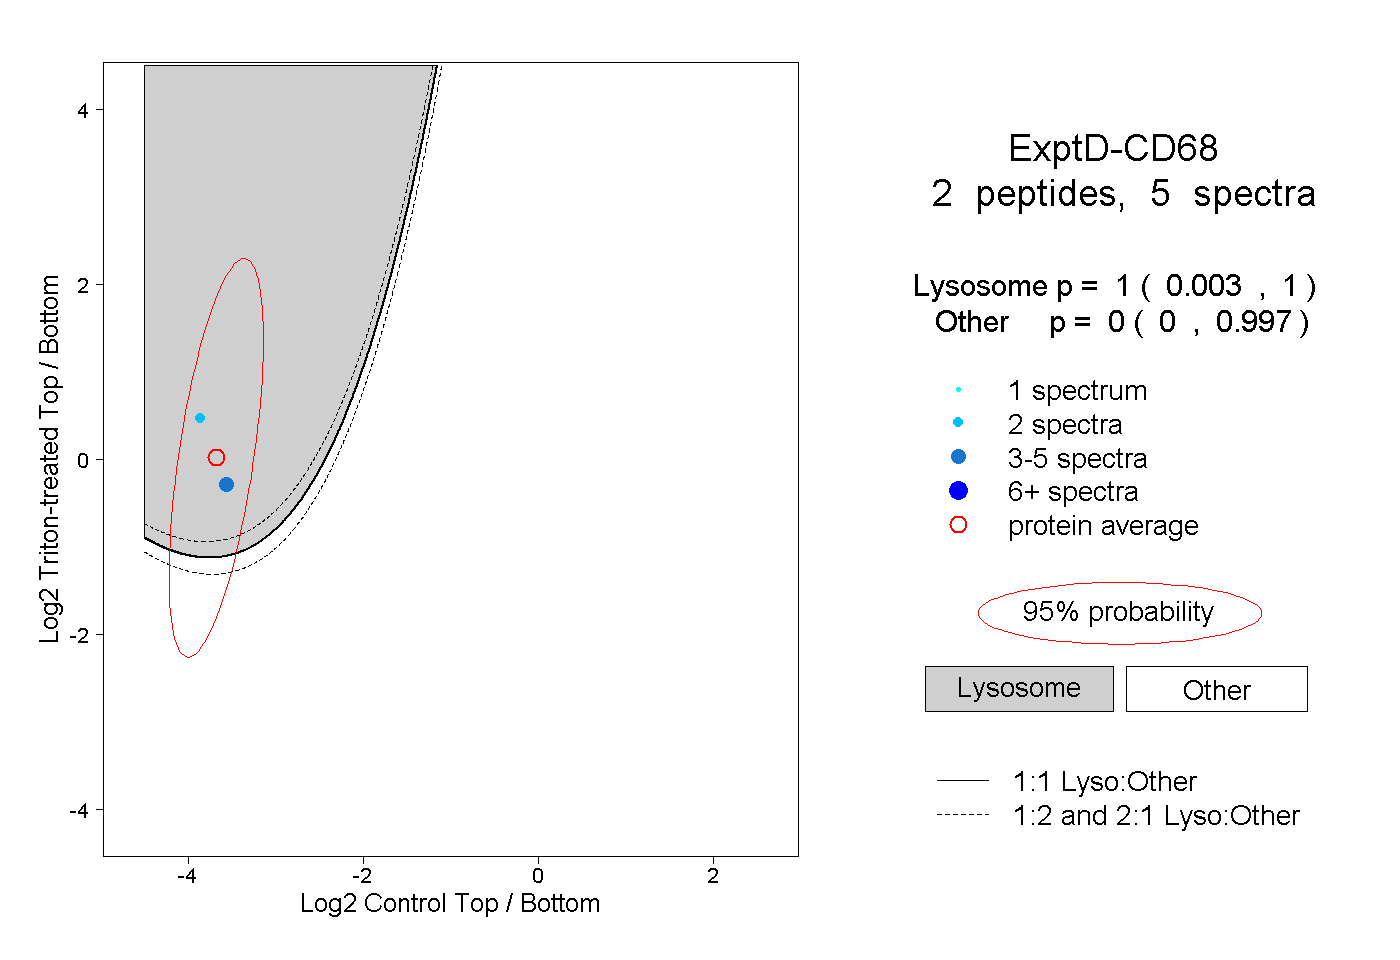
0.003 | 1.000
0.000 | 0.997