 3
3peptides
spectra
0.000 | 0.000
0.696 | 0.831
0.000 | 0.000
0.000 | 0.000
0.000 | 0.110
0.000 | 0.229
0.010 | 0.103
0.000 | 0.000
1peptide
spectrum
NA | NA
NA | NA
NA | NA
NA | NA
NA | NA
NA | NA
NA | NA
| Plot | Mito | Lyso | Perox | ER | Golgi | PM | Cytosol | Nucleus | |||||
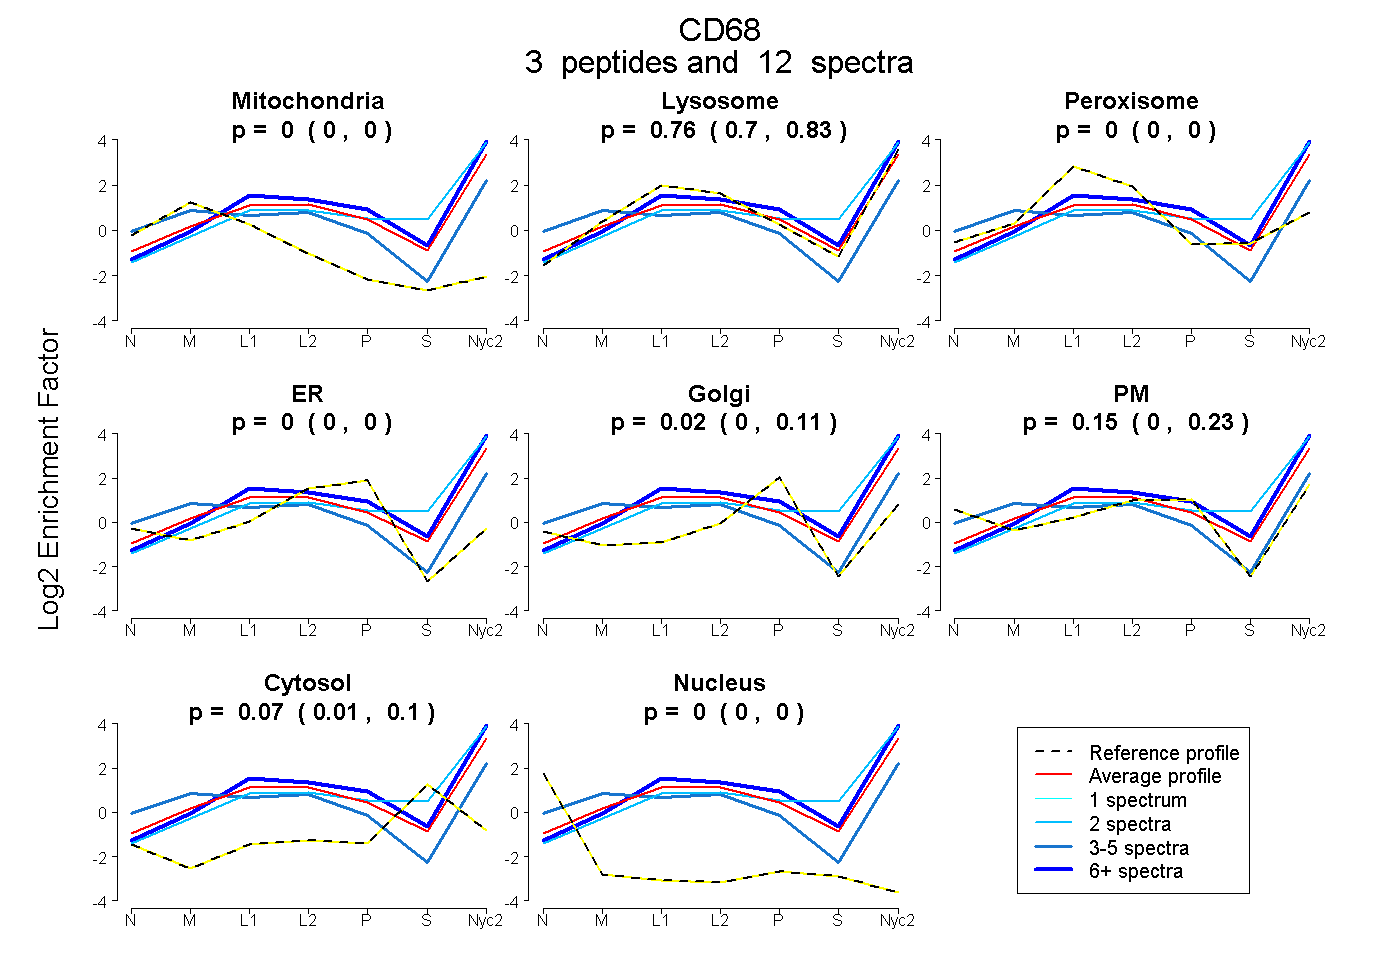
| Expt A |
3 peptides |
12 spectra |
|
0.000 0.000 | 0.000 |
0.764 0.696 | 0.831 |
0.000 0.000 | 0.000 |
0.000 0.000 | 0.000 |
0.016 0.000 | 0.110 |
0.155 0.000 | 0.229 |
0.065 0.010 | 0.103 |
0.000 0.000 | 0.000 |
||
| Plot | Mito | Lyso or Perox | ER | Golgi | PM | Cytosol | Nucleus | ||||||
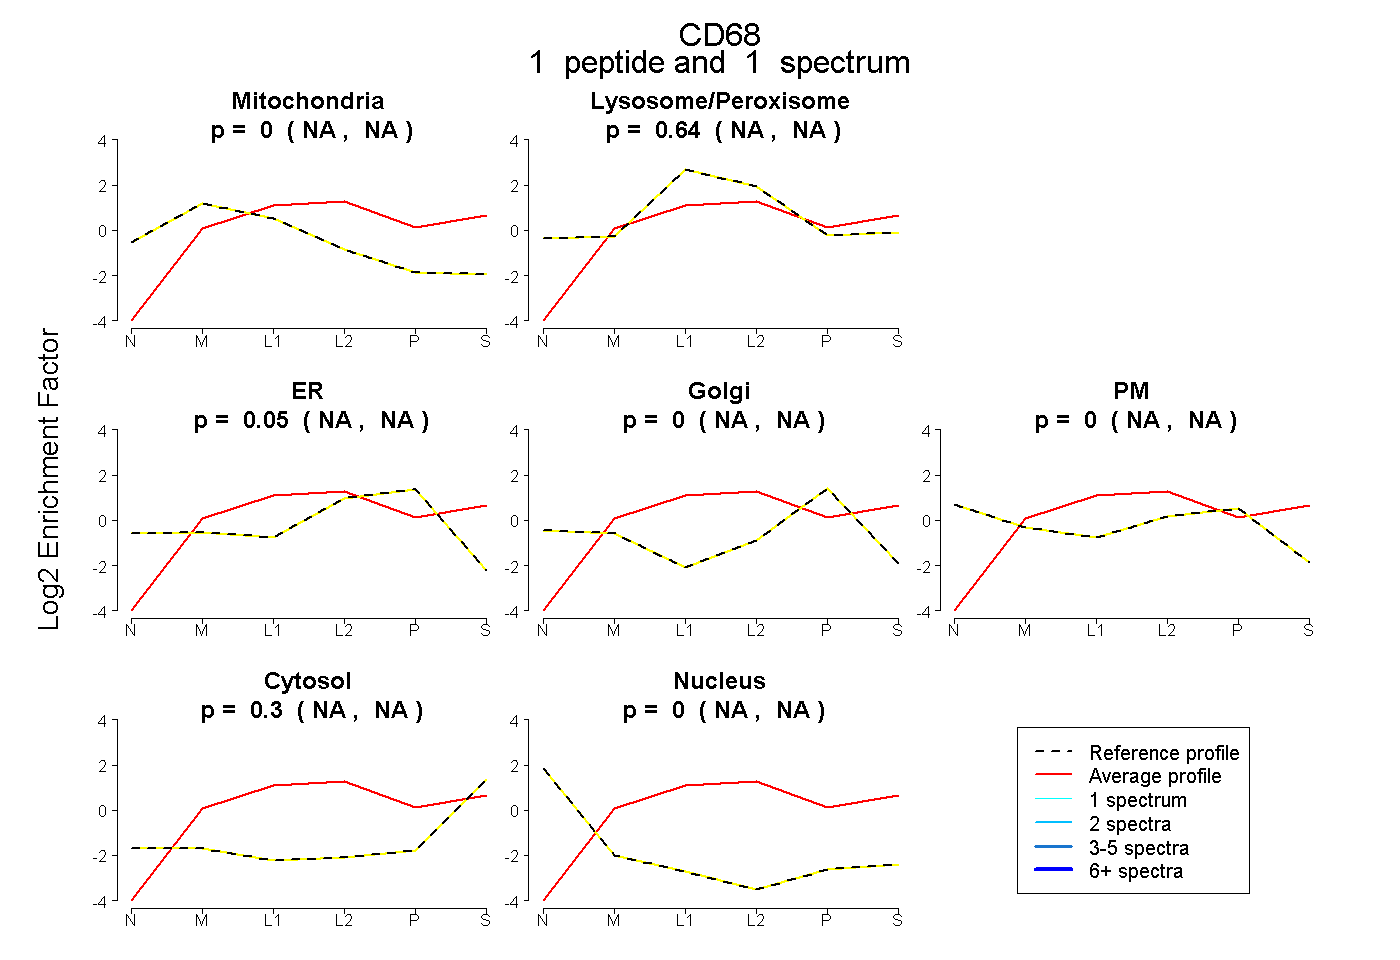
| Expt B |
1 peptide |
1 spectrum |
|
0.000 NA | NA |
0.641 NA | NA |
0.054 NA | NA |
0.000 NA | NA |
0.000 NA | NA |
0.305 NA | NA |
0.000 NA | NA |
| 1 spectrum, LQAAQLPDK | 0.000 | 0.641 | 0.054 | 0.000 | 0.000 | 0.305 | 0.000 |
| Plot | Lyso | Other | |||||||||||
| Expt C |
3 peptides |
69 spectra |
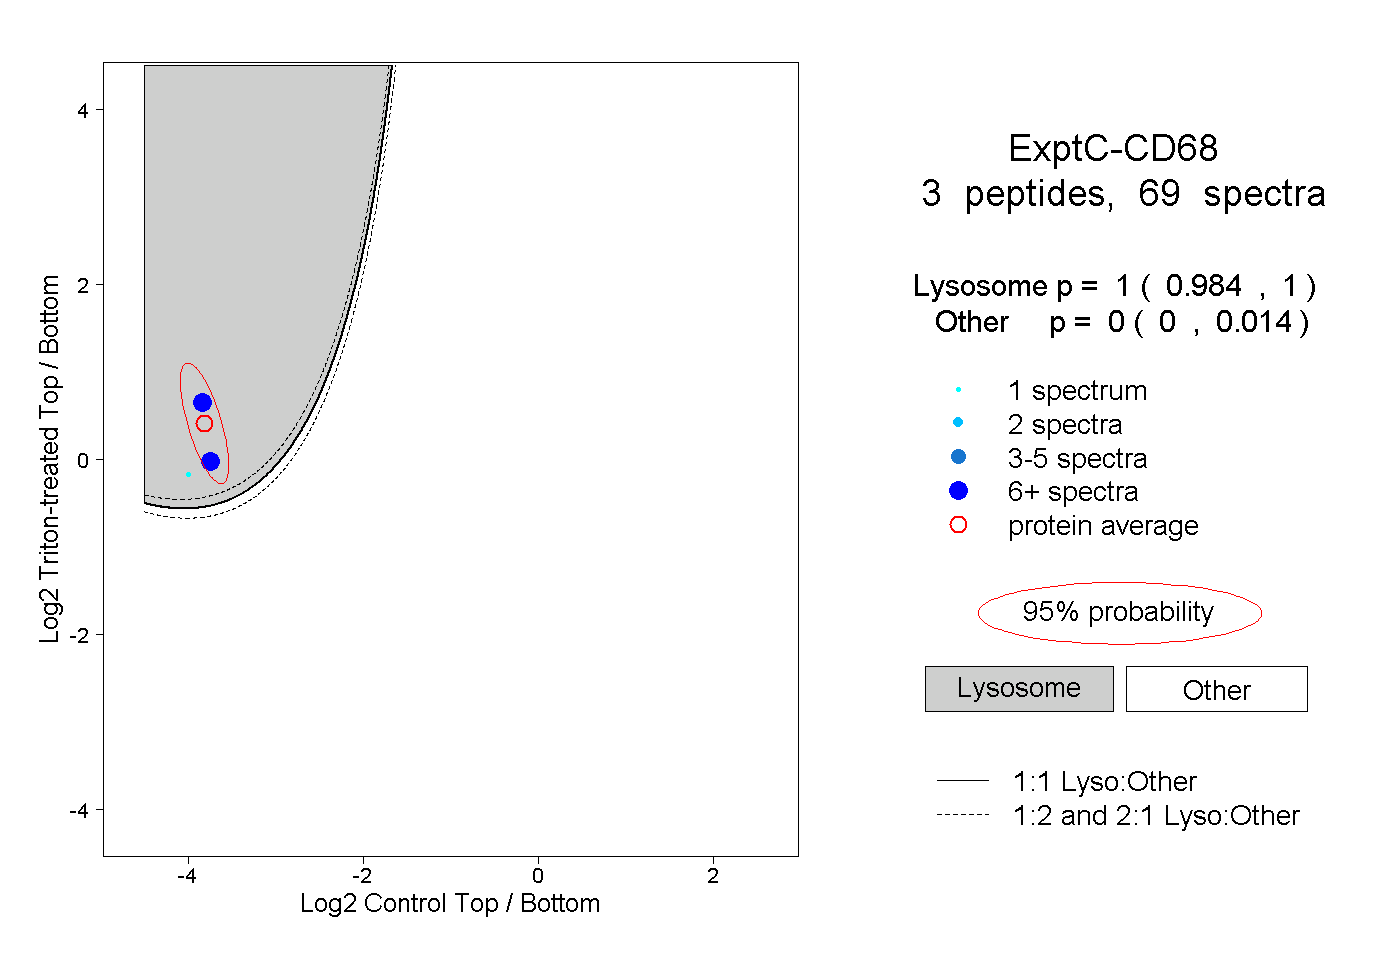 |
1.000 0.984 | 1.000 |
0.000 0.000 | 0.014 |
||||||||
| Plot | Lyso | Other | |||||||||||
| Expt D |
2 peptides |
5 spectra |
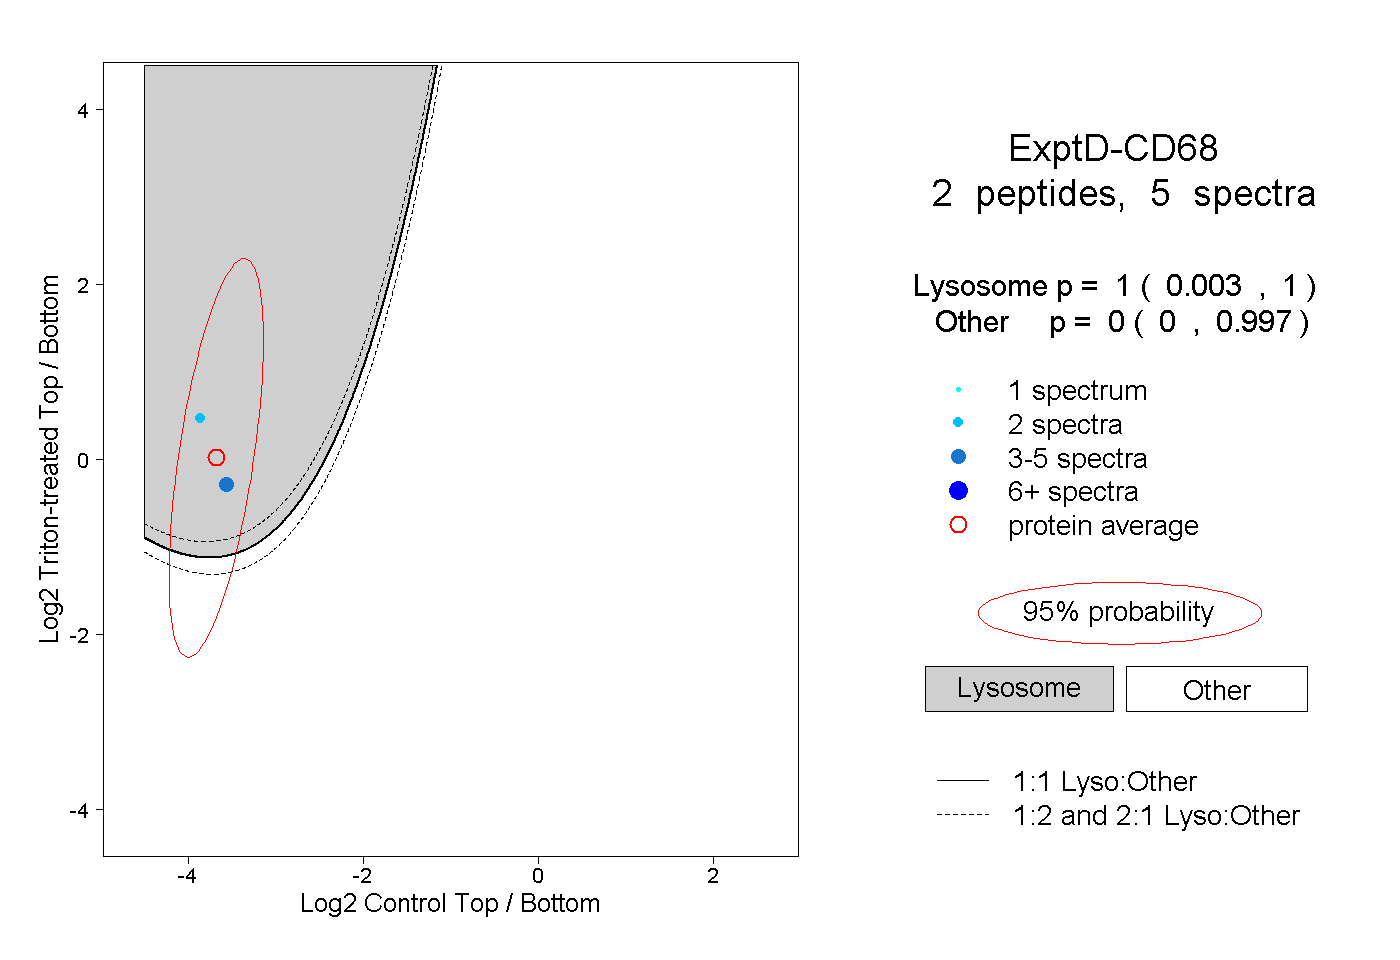 |
1.000 0.003 | 1.000 |
0.000 0.000 | 0.997 |