 7
7peptides
spectra
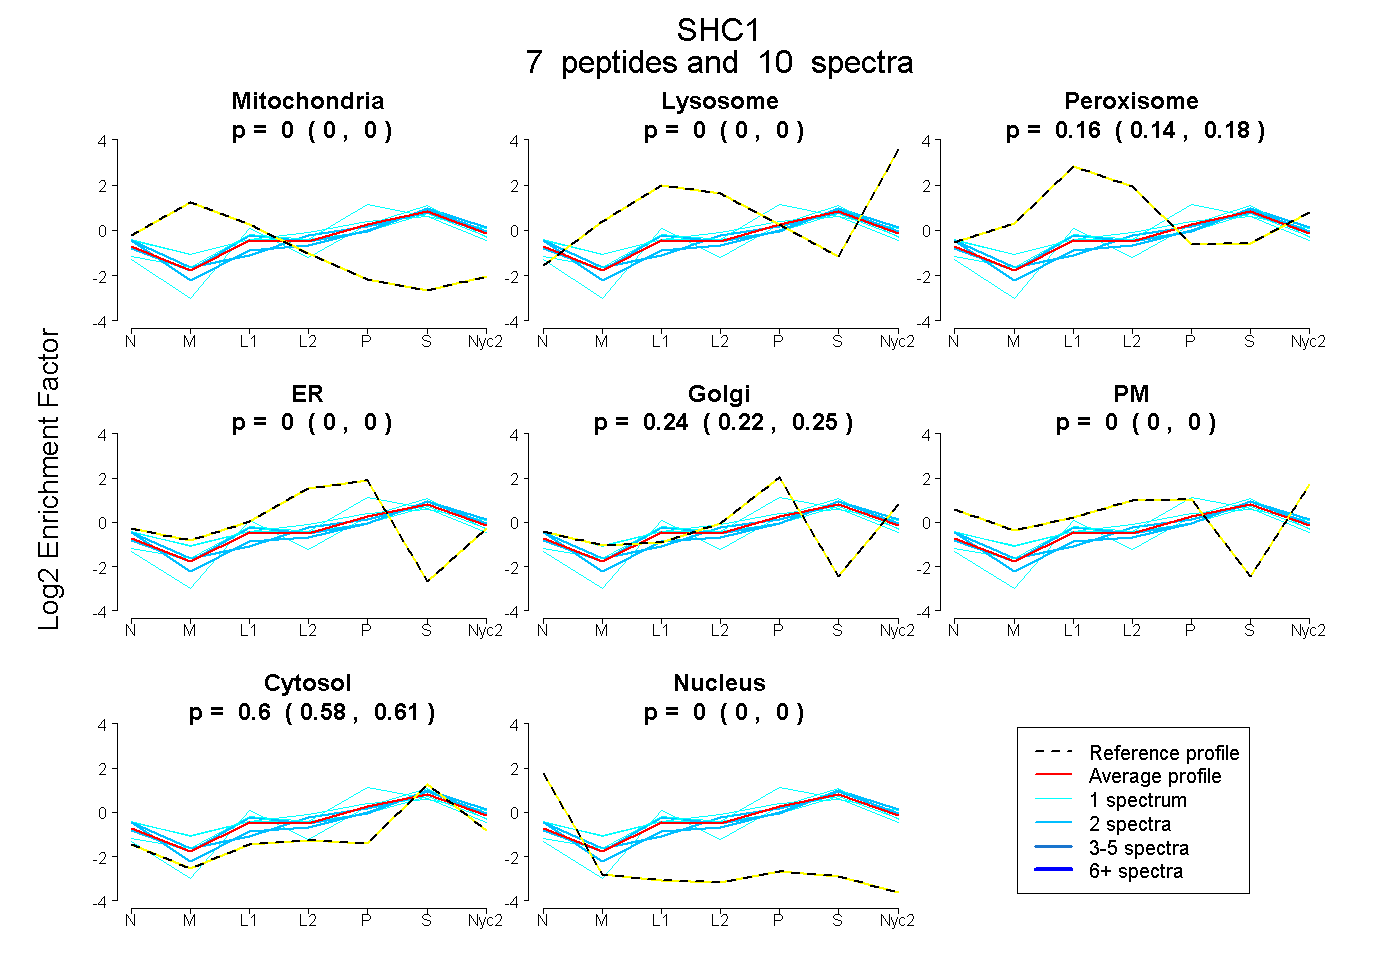
0.000 | 0.000
0.000 | 0.000
0.144 | 0.176
0.000 | 0.000
0.222 | 0.254
0.000 | 0.000
0.583 | 0.613
0.000 | 0.000
3peptides
spectra
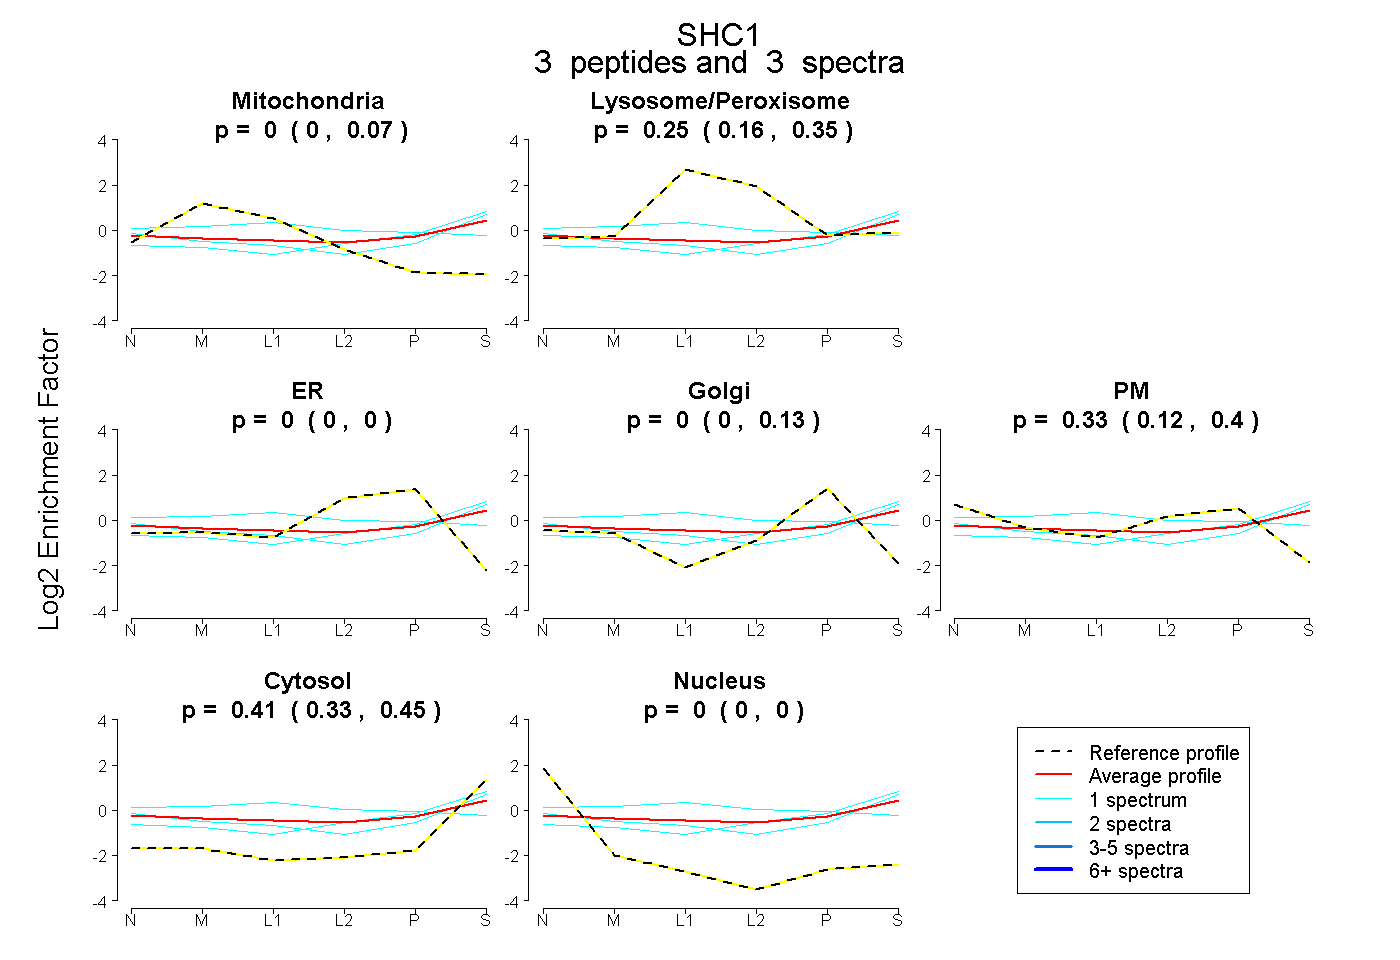
0.000 | 0.068
0.156 | 0.346
0.000 | 0.000
0.000 | 0.128
0.116 | 0.402
0.329 | 0.454
0.000 | 0.000
3peptides
spectra
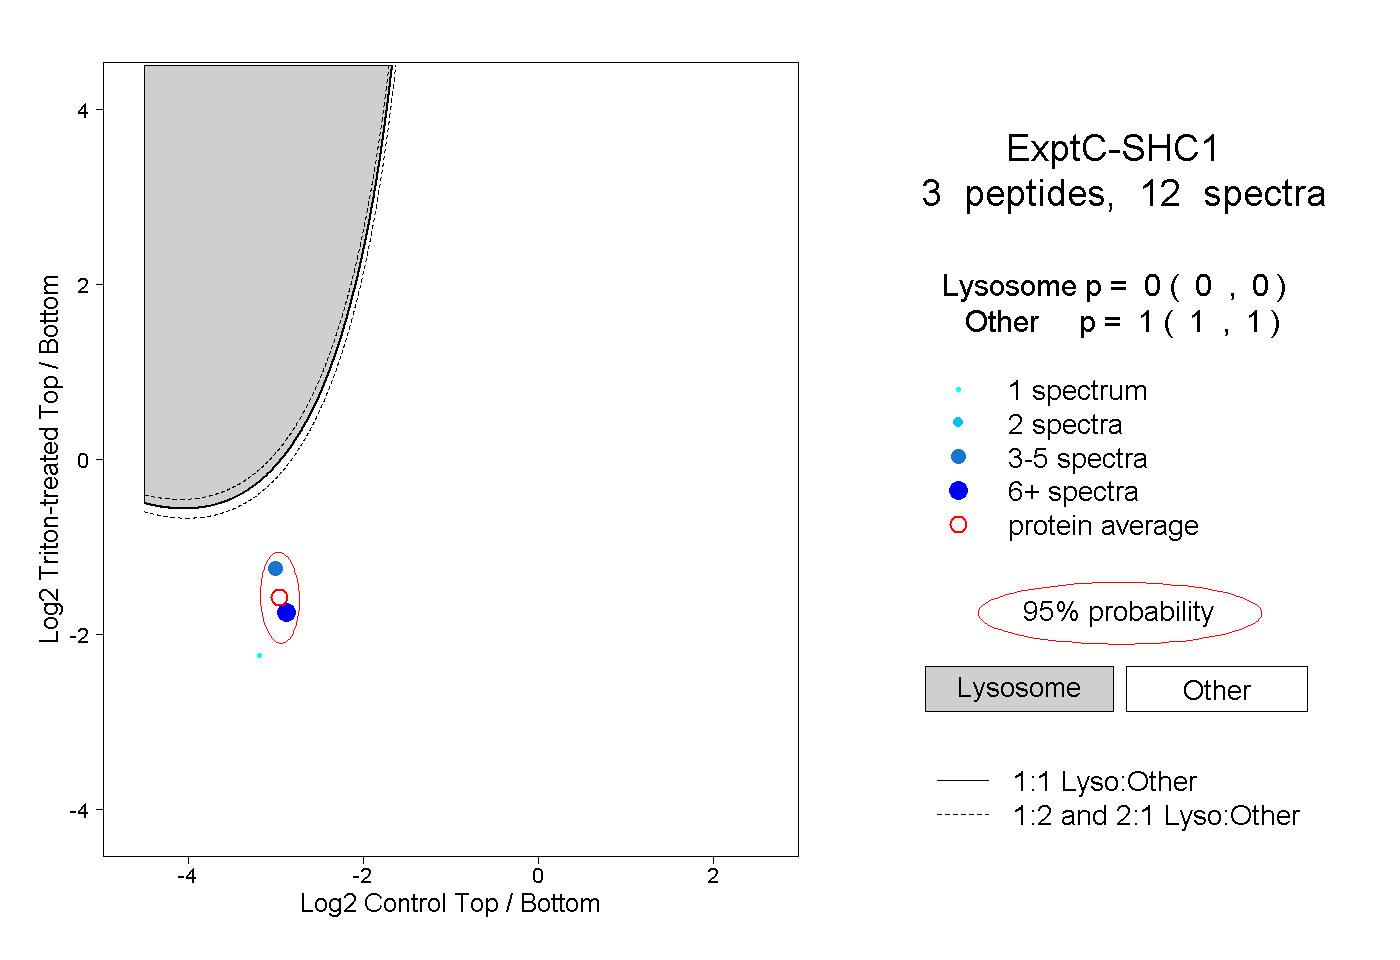
0.000 | 0.000
1.000 | 1.000
1peptide
spectra
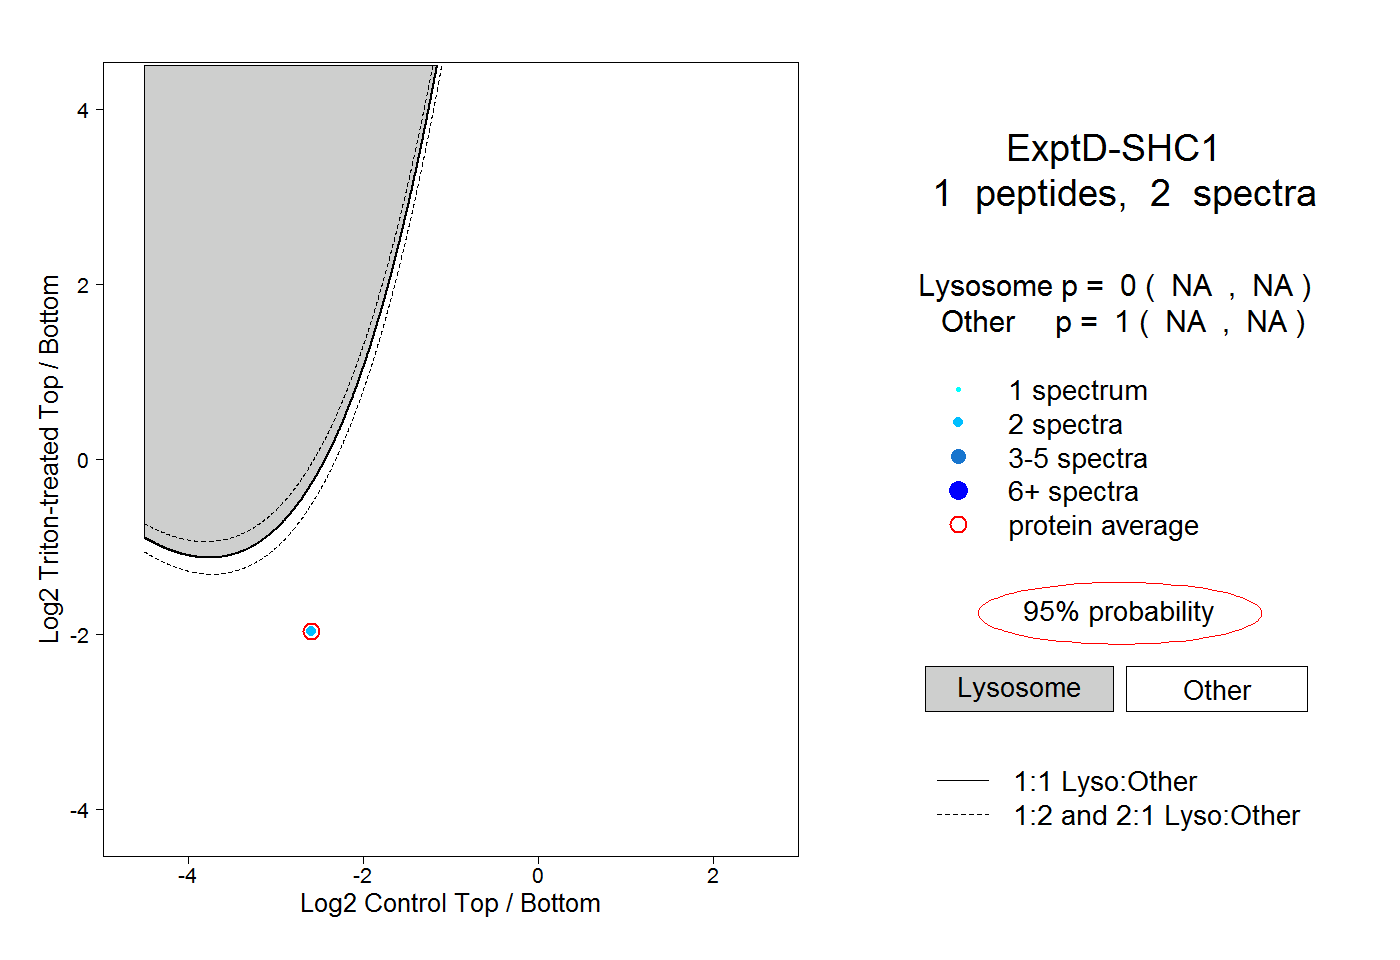
NA | NA
NA | NA