 7
7peptides
spectra
0.000 | 0.000
0.000 | 0.000
0.144 | 0.176
0.000 | 0.000
0.222 | 0.254
0.000 | 0.000
0.583 | 0.613
0.000 | 0.000
| Plot | Mito | Lyso | Perox | ER | Golgi | PM | Cytosol | Nucleus | |||||
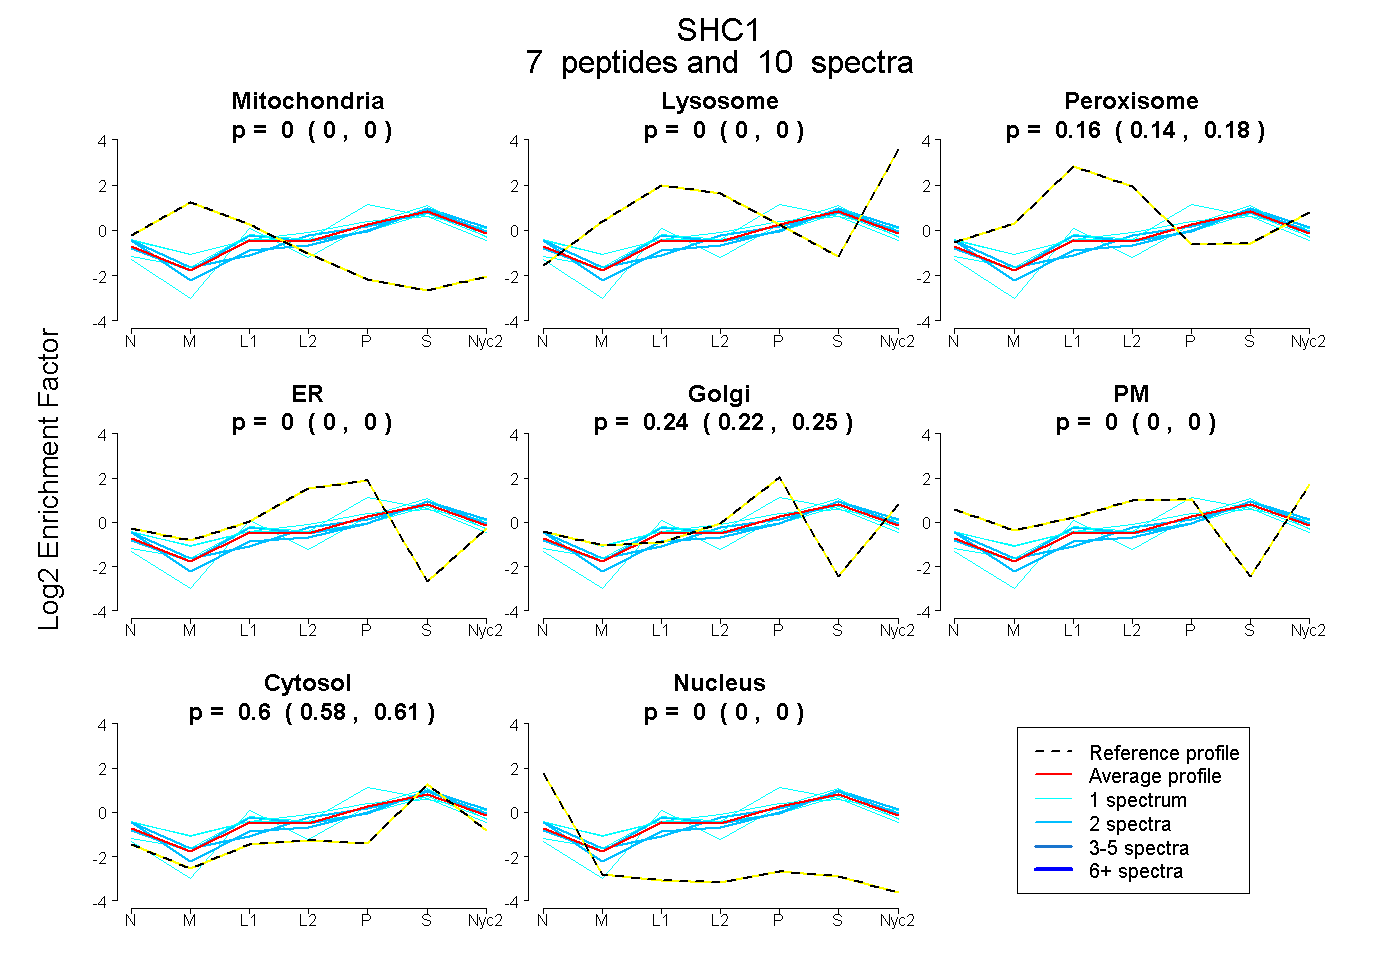
| Expt A |
7 peptides |
10 spectra |
|
0.000 0.000 | 0.000 |
0.000 0.000 | 0.000 |
0.161 0.144 | 0.176 |
0.000 0.000 | 0.000 |
0.239 0.222 | 0.254 |
0.000 0.000 | 0.000 |
0.600 0.583 | 0.613 |
0.000 0.000 | 0.000 |
| 2 spectra, VMGPGVSYLVR | 0.000 | 0.000 | 0.000 | 0.000 | 0.056 | 0.222 | 0.722 | 0.000 | ||
| 1 spectrum, QMLPPPPCPGR | 0.000 | 0.000 | 0.108 | 0.159 | 0.210 | 0.000 | 0.523 | 0.000 | ||
| 2 spectra, LVTPHDR | 0.000 | 0.000 | 0.000 | 0.100 | 0.026 | 0.213 | 0.660 | 0.000 | ||
| 1 spectrum, ELFDDPSYVNIQNLDK | 0.000 | 0.017 | 0.087 | 0.000 | 0.145 | 0.000 | 0.751 | 0.000 | ||
| 1 spectrum, ALDFNTR | 0.000 | 0.000 | 0.217 | 0.000 | 0.158 | 0.056 | 0.569 | 0.000 | ||
| 1 spectrum, HLLLVDPEGVVR | 0.000 | 0.000 | 0.234 | 0.000 | 0.281 | 0.013 | 0.472 | 0.000 | ||
| 2 spectra, DLFDMKPFEDALR | 0.000 | 0.086 | 0.150 | 0.000 | 0.134 | 0.000 | 0.630 | 0.000 |
| Plot | Mito | Lyso or Perox | ER | Golgi | PM | Cytosol | Nucleus | ||||||
| Expt B |
3 peptides |
3 spectra |
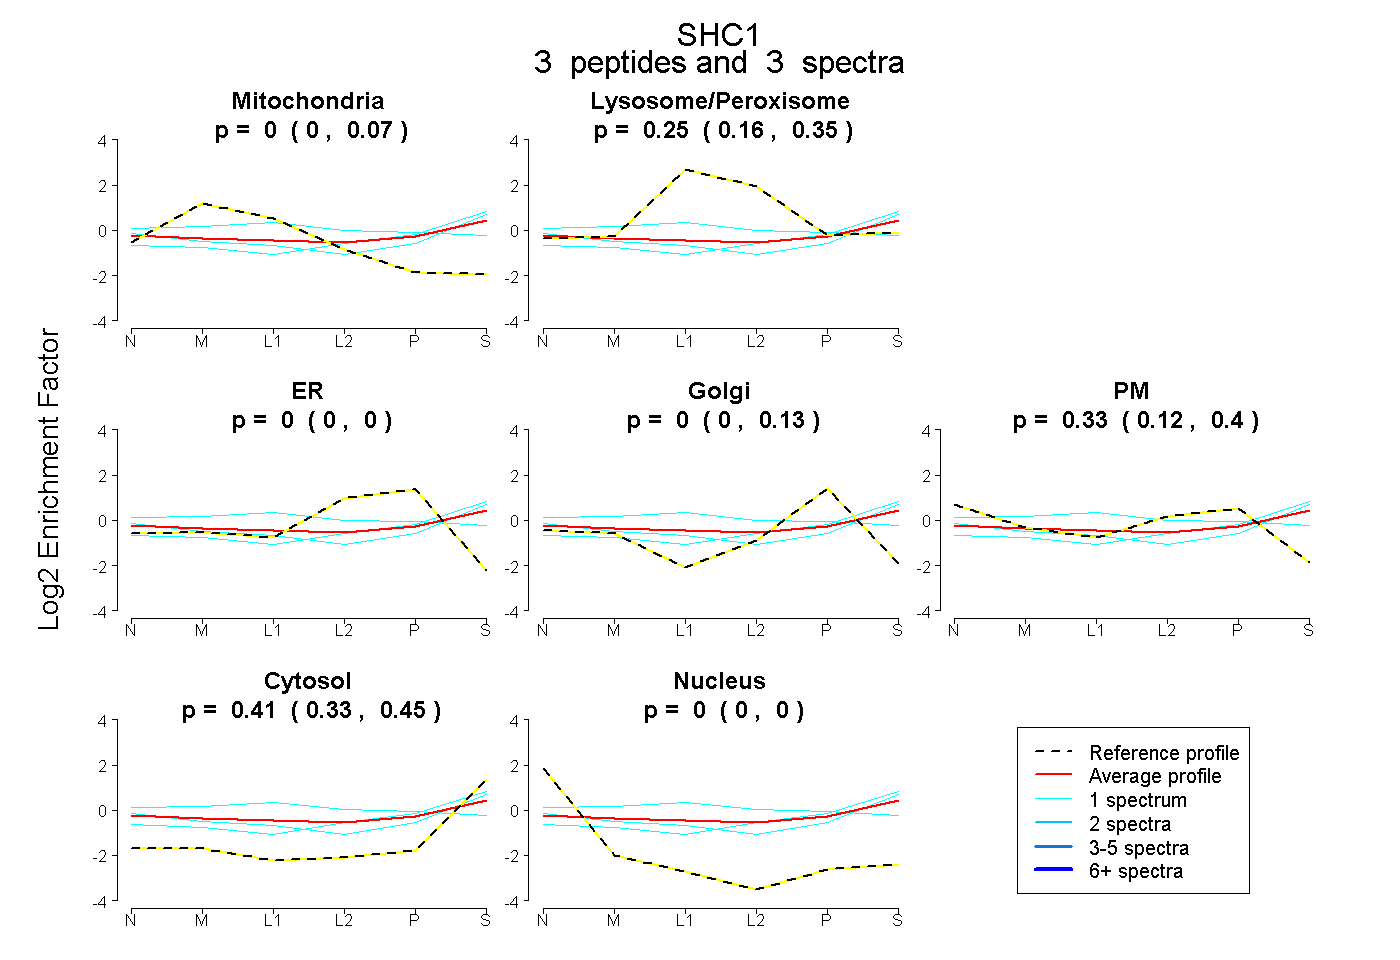 |
0.000 0.000 | 0.068 |
0.255 0.156 | 0.346 |
0.000 0.000 | 0.000 |
0.000 0.000 | 0.128 |
0.335 0.116 | 0.402 |
0.410 0.329 | 0.454 |
0.000 0.000 | 0.000 |
|||
| Plot | Lyso | Other | |||||||||||
| Expt C |
3 peptides |
12 spectra |
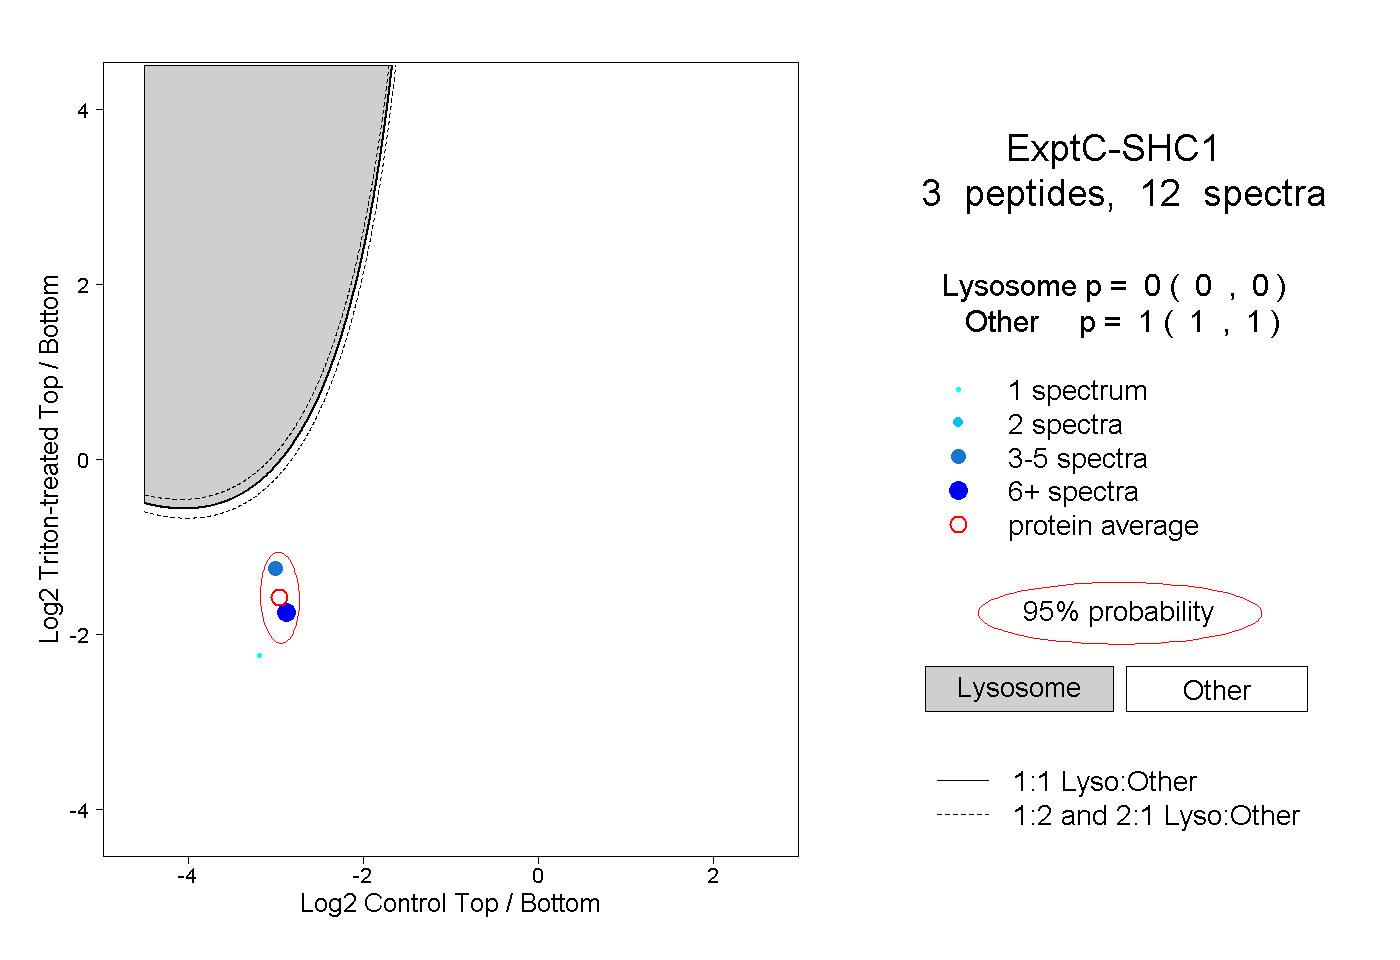 |
0.000 0.000 | 0.000 |
1.000 1.000 | 1.000 |
||||||||
| Plot | Lyso | Other | |||||||||||
| Expt D |
1 peptide |
2 spectra |
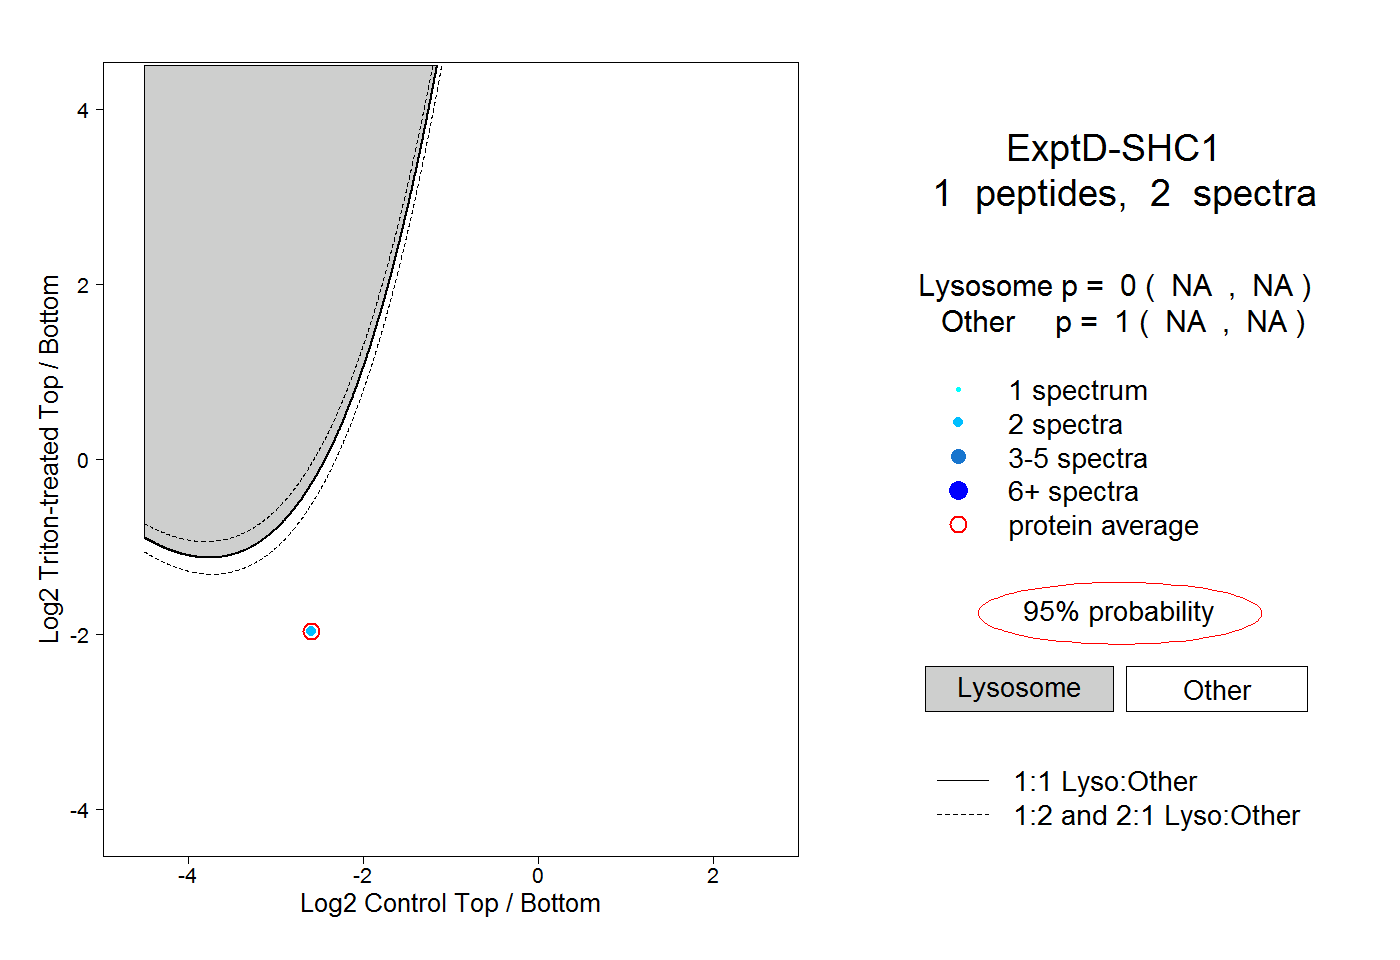 |
0.000 NA | NA |
1.000 NA | NA |