 16
16peptides
spectra
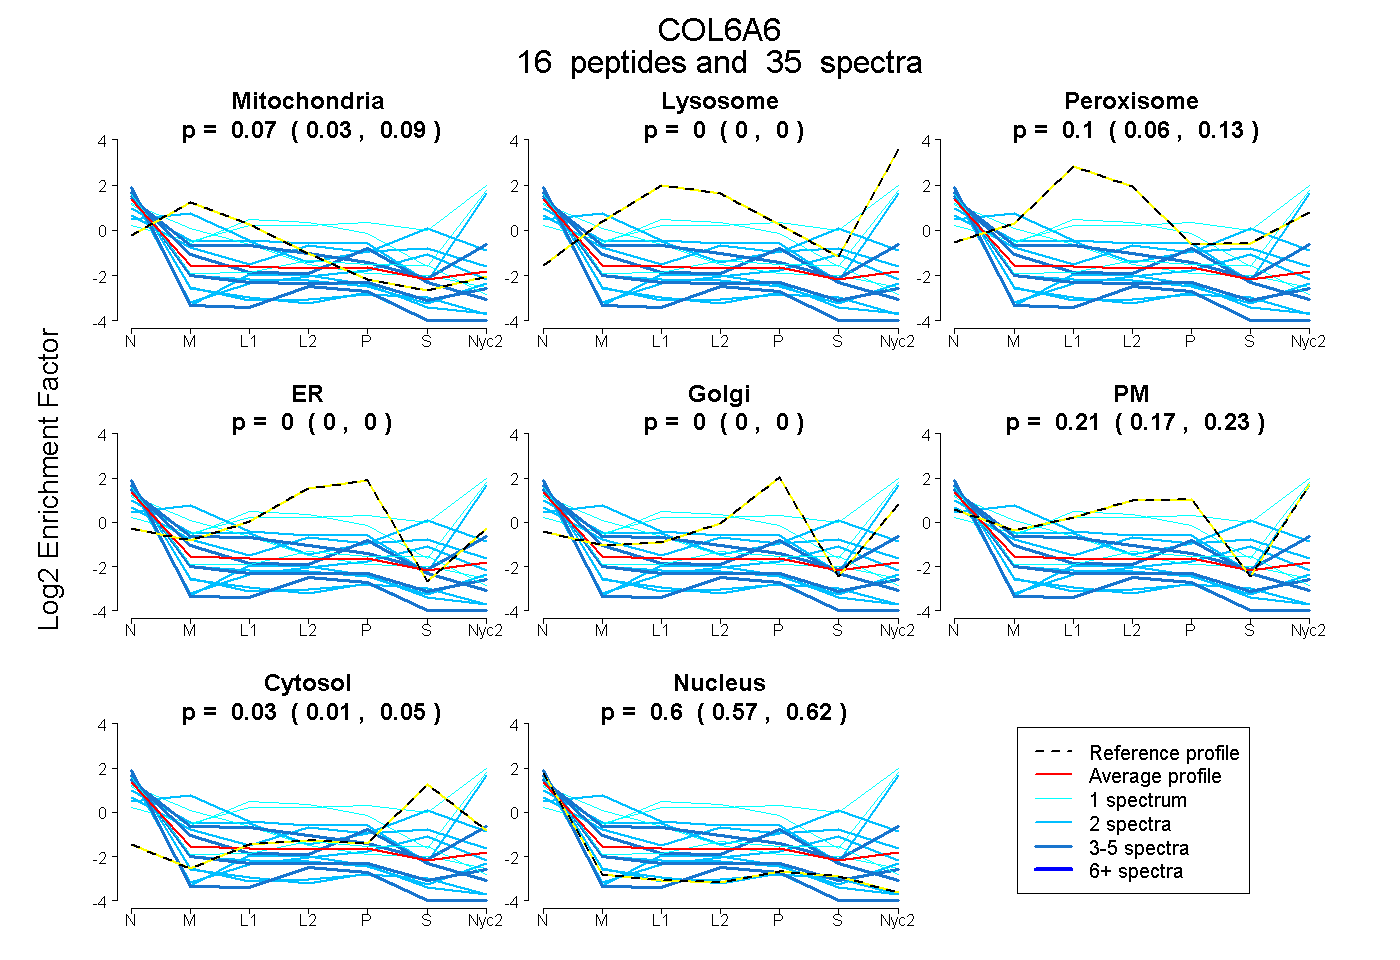
0.028 | 0.093
0.000 | 0.000
0.057 | 0.133
0.000 | 0.000
0.000 | 0.000
0.173 | 0.235
0.007 | 0.050
0.572 | 0.622
2peptides
spectra
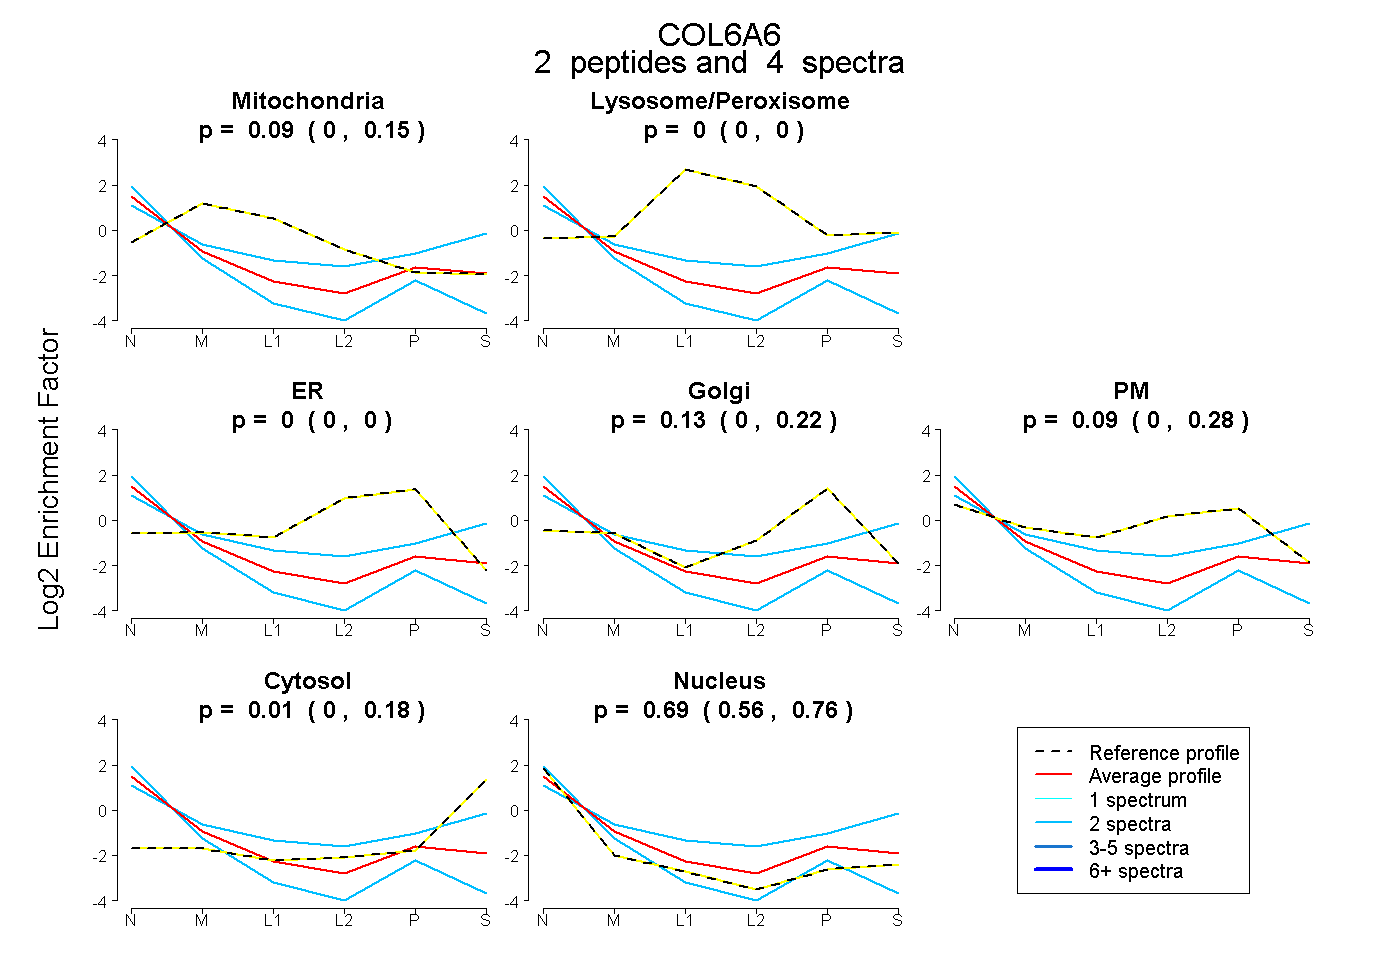
0.000 | 0.154
0.000 | 0.000
0.000 | 0.000
0.000 | 0.223
0.000 | 0.281
0.000 | 0.177
0.558 | 0.756
4peptides
spectra
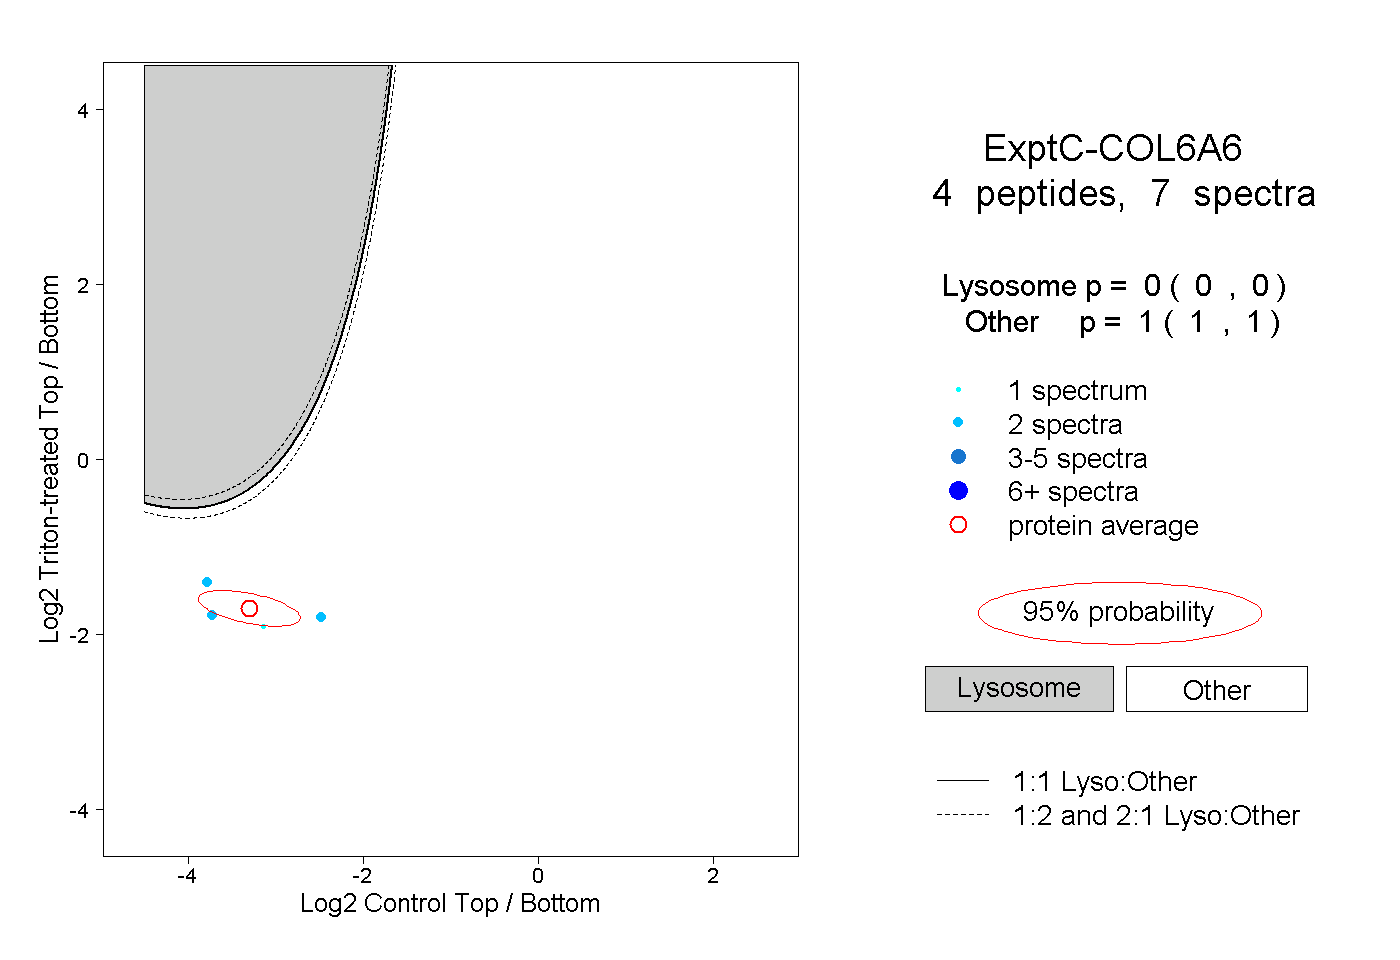
0.000 | 0.000
1.000 | 1.000
1peptide
spectrum
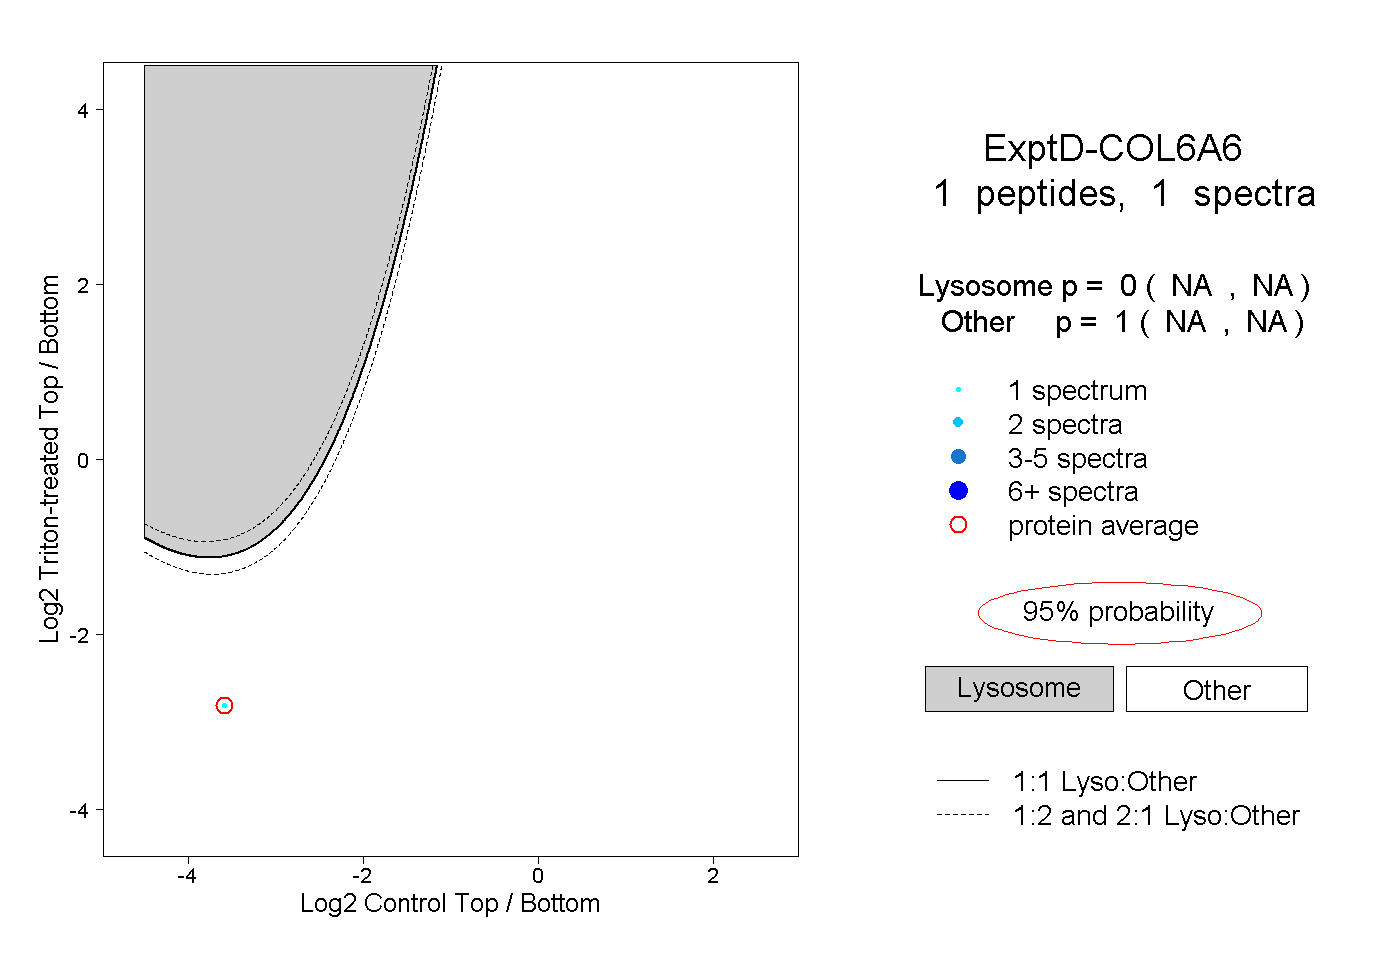
NA | NA
NA | NA