 16
16peptides
spectra
0.028 | 0.093
0.000 | 0.000
0.057 | 0.133
0.000 | 0.000
0.000 | 0.000
0.173 | 0.235
0.007 | 0.050
0.572 | 0.622
| Plot | Mito | Lyso | Perox | ER | Golgi | PM | Cytosol | Nucleus | |||||
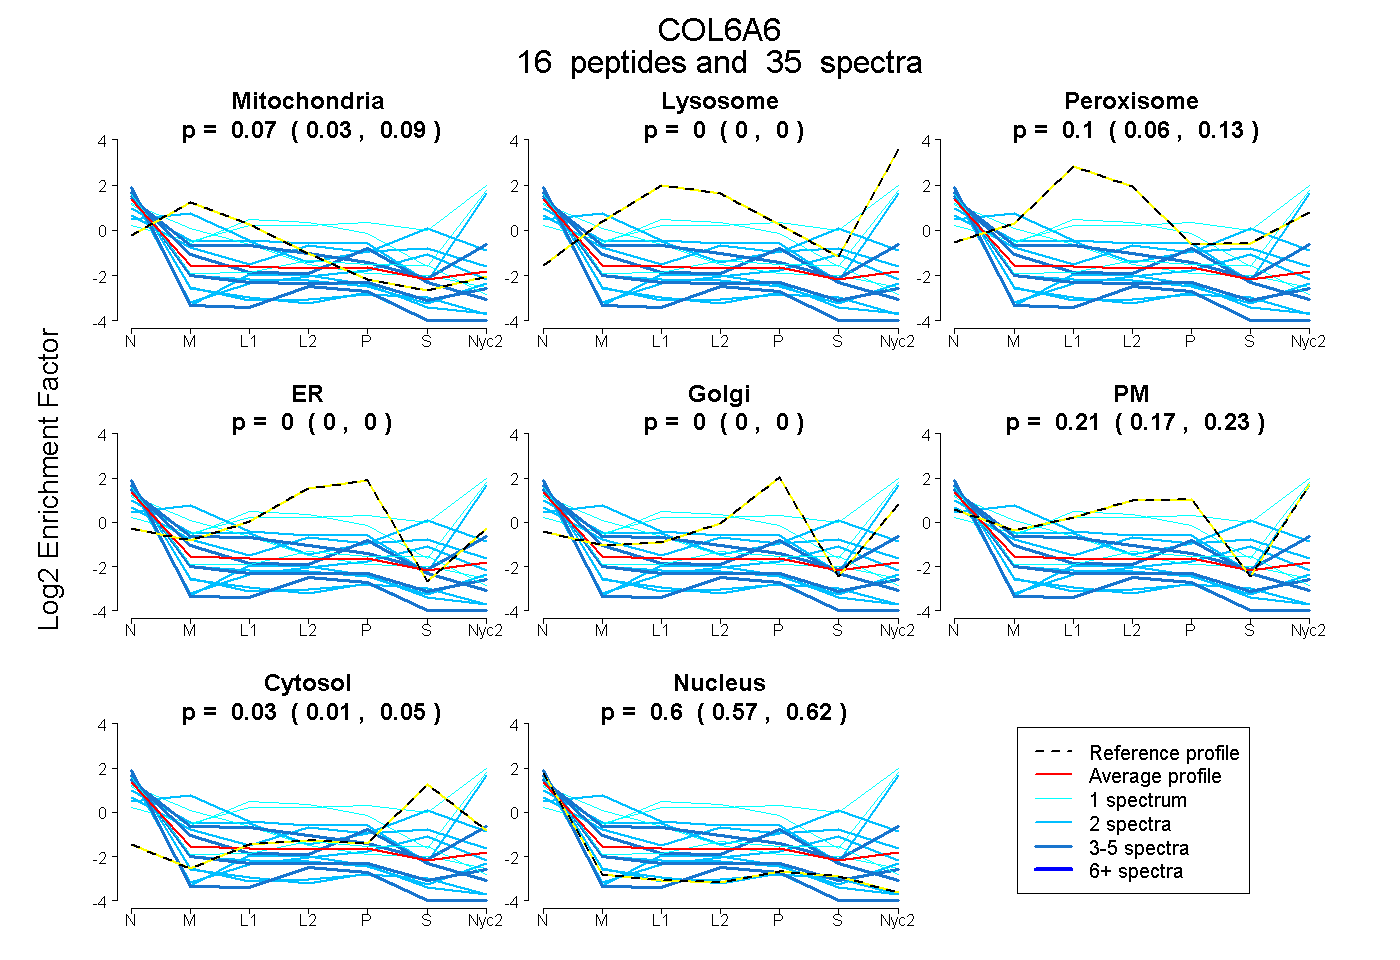
| Expt A |
16 peptides |
35 spectra |
|
0.066 0.028 | 0.093 |
0.000 0.000 | 0.000 |
0.097 0.057 | 0.133 |
0.000 0.000 | 0.000 |
0.000 0.000 | 0.000 |
0.207 0.173 | 0.235 |
0.033 0.007 | 0.050 |
0.598 0.572 | 0.622 |
| 1 spectrum, YTNKPDLGK | 0.000 | 0.000 | 0.151 | 0.107 | 0.000 | 0.000 | 0.082 | 0.659 | ||
| 2 spectra, IGVAQFSDSYR | 0.094 | 0.000 | 0.000 | 0.000 | 0.000 | 0.160 | 0.000 | 0.746 | ||
| 2 spectra, NQVVQEICAEEACR | 0.132 | 0.000 | 0.000 | 0.000 | 0.000 | 0.257 | 0.472 | 0.139 | ||
| 1 spectrum, IFLSEVVDMFNIAPHK | 0.523 | 0.000 | 0.116 | 0.000 | 0.000 | 0.000 | 0.000 | 0.361 | ||
| 2 spectra, DASCPVGAR | 0.003 | 0.000 | 0.000 | 0.000 | 0.000 | 0.000 | 0.000 | 0.997 | ||
| 2 spectra, ASEEDLK | 0.000 | 0.000 | 0.000 | 0.000 | 0.000 | 0.075 | 0.317 | 0.608 | ||
| 4 spectra, VALLSHAPVDFLPNTQR | 0.000 | 0.000 | 0.000 | 0.000 | 0.000 | 0.000 | 0.000 | 1.000 | ||
| 2 spectra, AFLGESVSALDIK | 0.237 | 0.000 | 0.166 | 0.000 | 0.000 | 0.110 | 0.204 | 0.283 | ||
| 4 spectra, TLPGAHVR | 0.167 | 0.000 | 0.000 | 0.242 | 0.000 | 0.000 | 0.000 | 0.591 | ||
| 2 spectra, EVFSAQR | 0.000 | 0.000 | 0.029 | 0.091 | 0.000 | 0.000 | 0.000 | 0.880 | ||
| 1 spectrum, TCCCLLCK | 0.000 | 0.301 | 0.000 | 0.000 | 0.000 | 0.400 | 0.299 | 0.000 | ||
| 2 spectra, DVTEQDFER | 0.023 | 0.000 | 0.000 | 0.000 | 0.000 | 0.000 | 0.000 | 0.977 | ||
| 3 spectra, SQDEVAQAAEELR | 0.094 | 0.000 | 0.000 | 0.000 | 0.000 | 0.140 | 0.000 | 0.767 | ||
| 2 spectra, NFGFIGGSLK | 0.230 | 0.228 | 0.000 | 0.000 | 0.000 | 0.432 | 0.000 | 0.111 | ||
| 4 spectra, VDCEIEK | 0.153 | 0.016 | 0.124 | 0.000 | 0.000 | 0.323 | 0.000 | 0.385 | ||
| 1 spectrum, DFMIGLVK | 0.000 | 0.196 | 0.097 | 0.000 | 0.000 | 0.563 | 0.000 | 0.144 |
| Plot | Mito | Lyso or Perox | ER | Golgi | PM | Cytosol | Nucleus | ||||||
| Expt B |
2 peptides |
4 spectra |
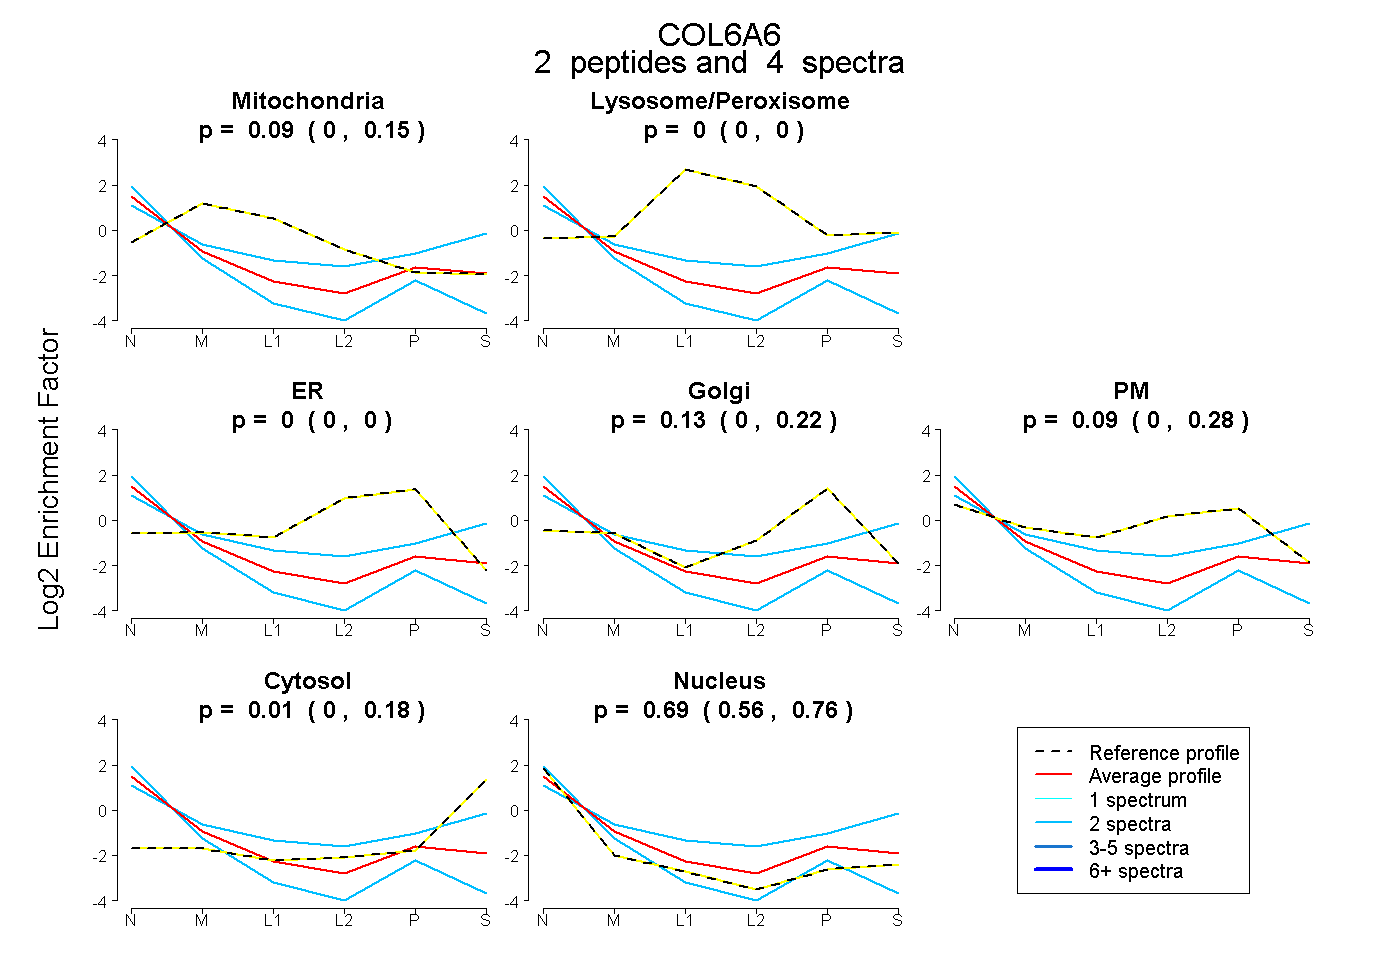 |
0.088 0.000 | 0.154 |
0.000 0.000 | 0.000 |
0.000 0.000 | 0.000 |
0.125 0.000 | 0.223 |
0.090 0.000 | 0.281 |
0.008 0.000 | 0.177 |
0.689 0.558 | 0.756 |
|||
| Plot | Lyso | Other | |||||||||||
| Expt C |
4 peptides |
7 spectra |
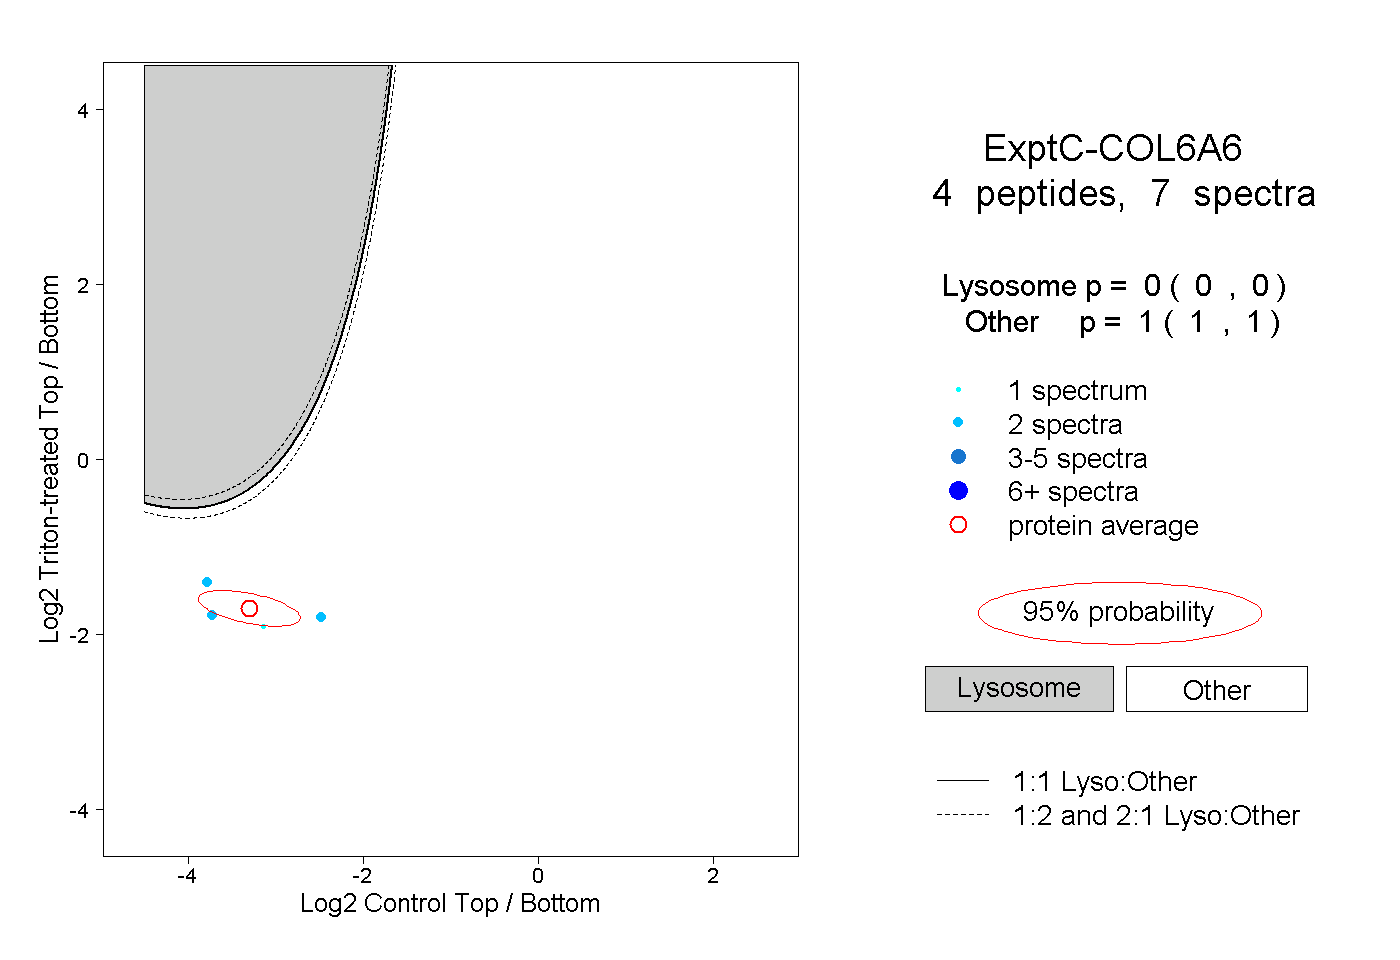 |
0.000 0.000 | 0.000 |
1.000 1.000 | 1.000 |
||||||||
| Plot | Lyso | Other | |||||||||||
| Expt D |
1 peptide |
1 spectrum |
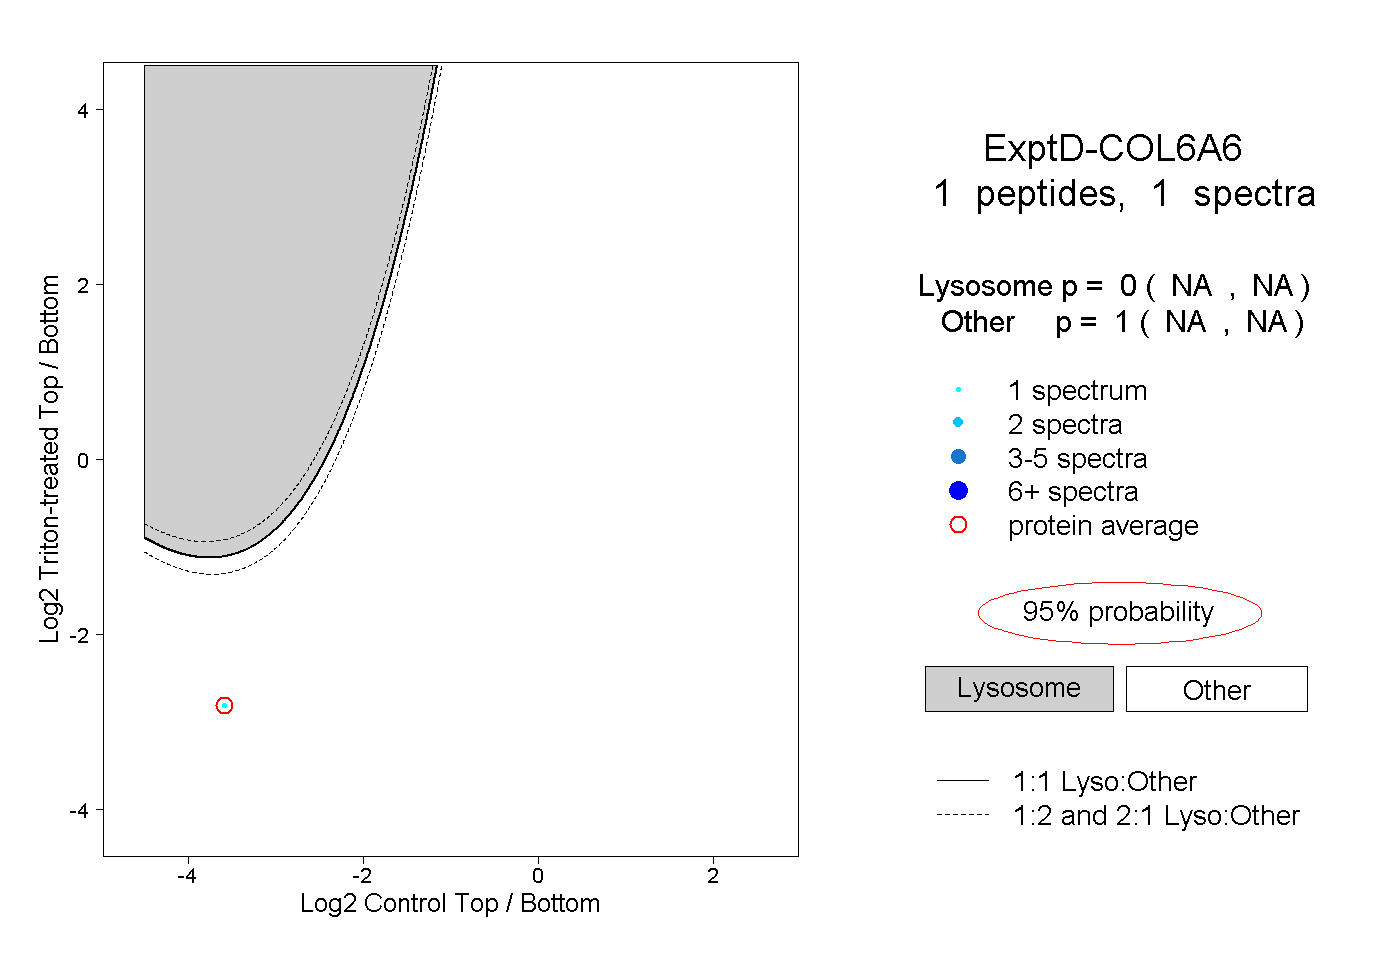 |
0.000 NA | NA |
1.000 NA | NA |