 11
11peptides
spectra
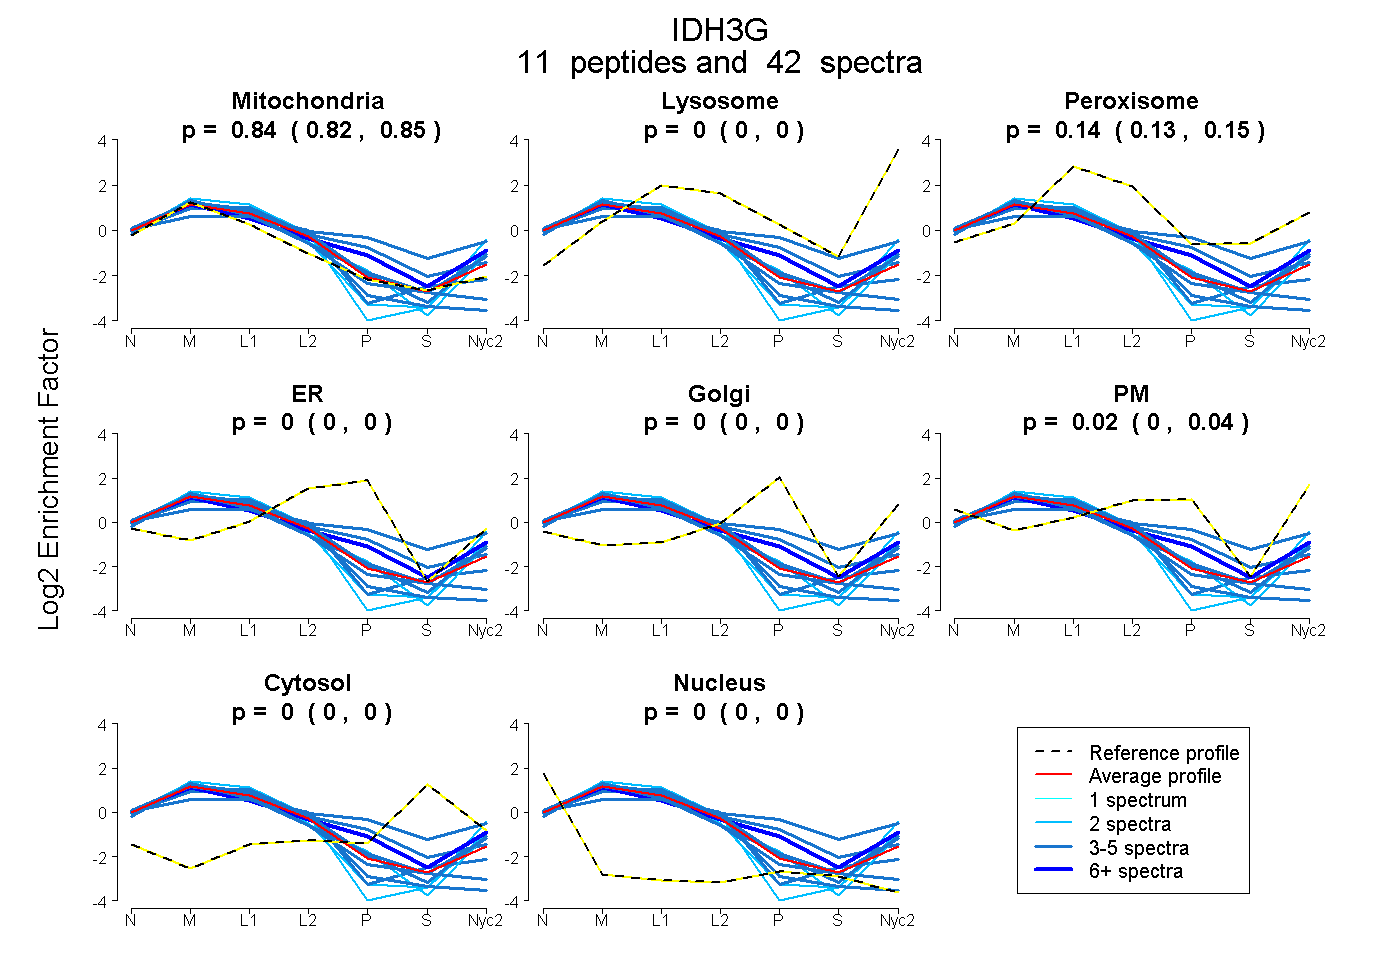
0.821 | 0.849
0.000 | 0.000
0.130 | 0.149
0.000 | 0.000
0.000 | 0.000
0.004 | 0.039
0.000 | 0.000
0.000 | 0.000
6peptides
spectra
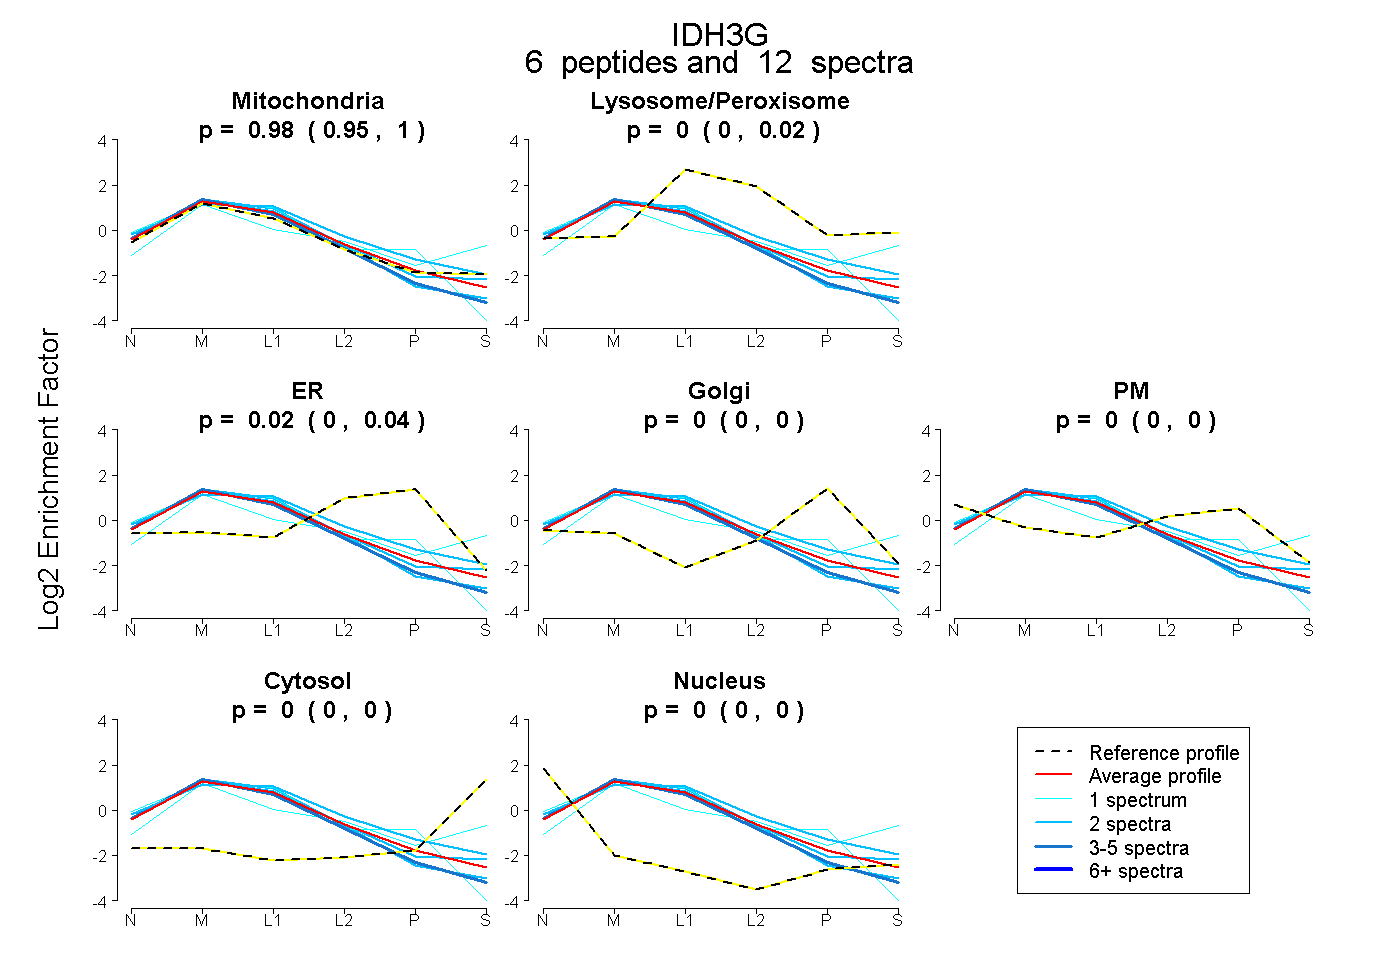
0.949 | 0.998
0.000 | 0.021
0.000 | 0.044
0.000 | 0.000
0.000 | 0.000
0.000 | 0.000
0.000 | 0.000
11peptides
spectra
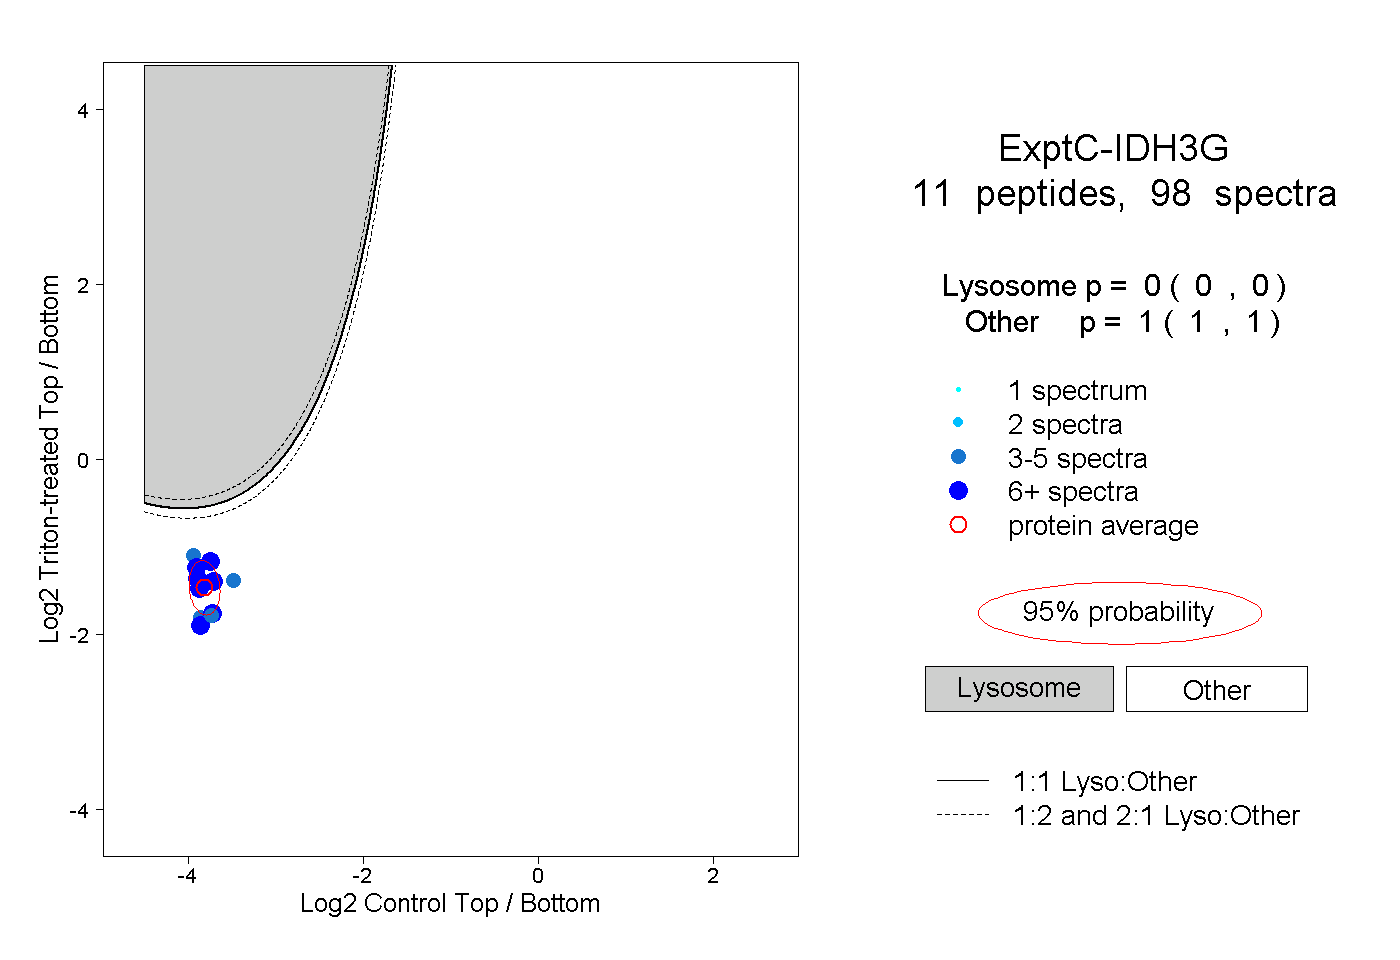
0.000 | 0.000
1.000 | 1.000
4peptides
spectra
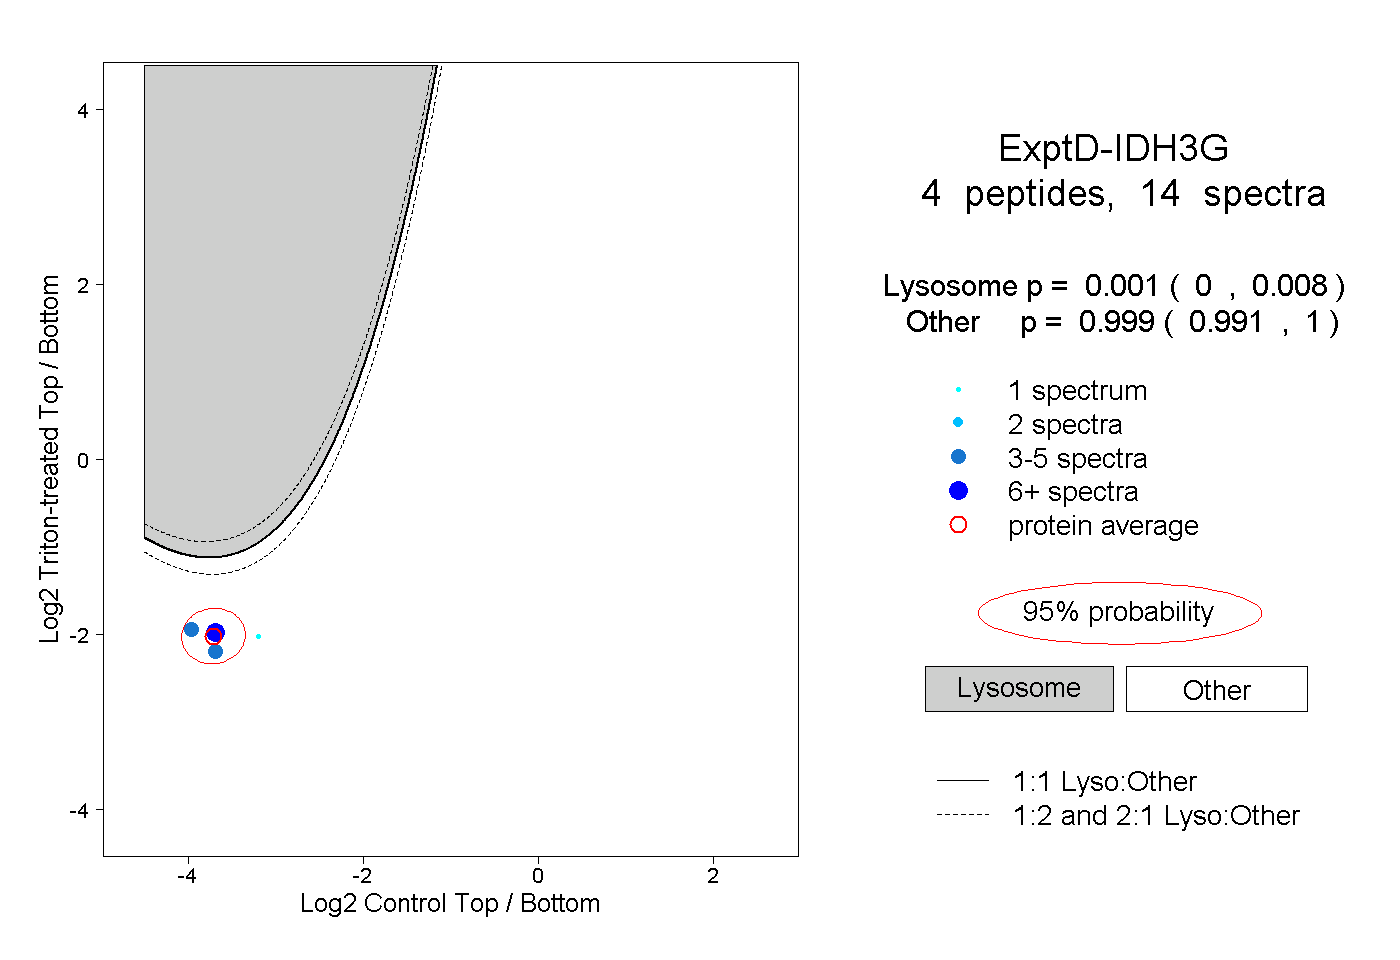
0.000 | 0.008
0.991 | 1.000