 11
11peptides
spectra
0.821 | 0.849
0.000 | 0.000
0.130 | 0.149
0.000 | 0.000
0.000 | 0.000
0.004 | 0.039
0.000 | 0.000
0.000 | 0.000
| Plot | Mito | Lyso | Perox | ER | Golgi | PM | Cytosol | Nucleus | |||||
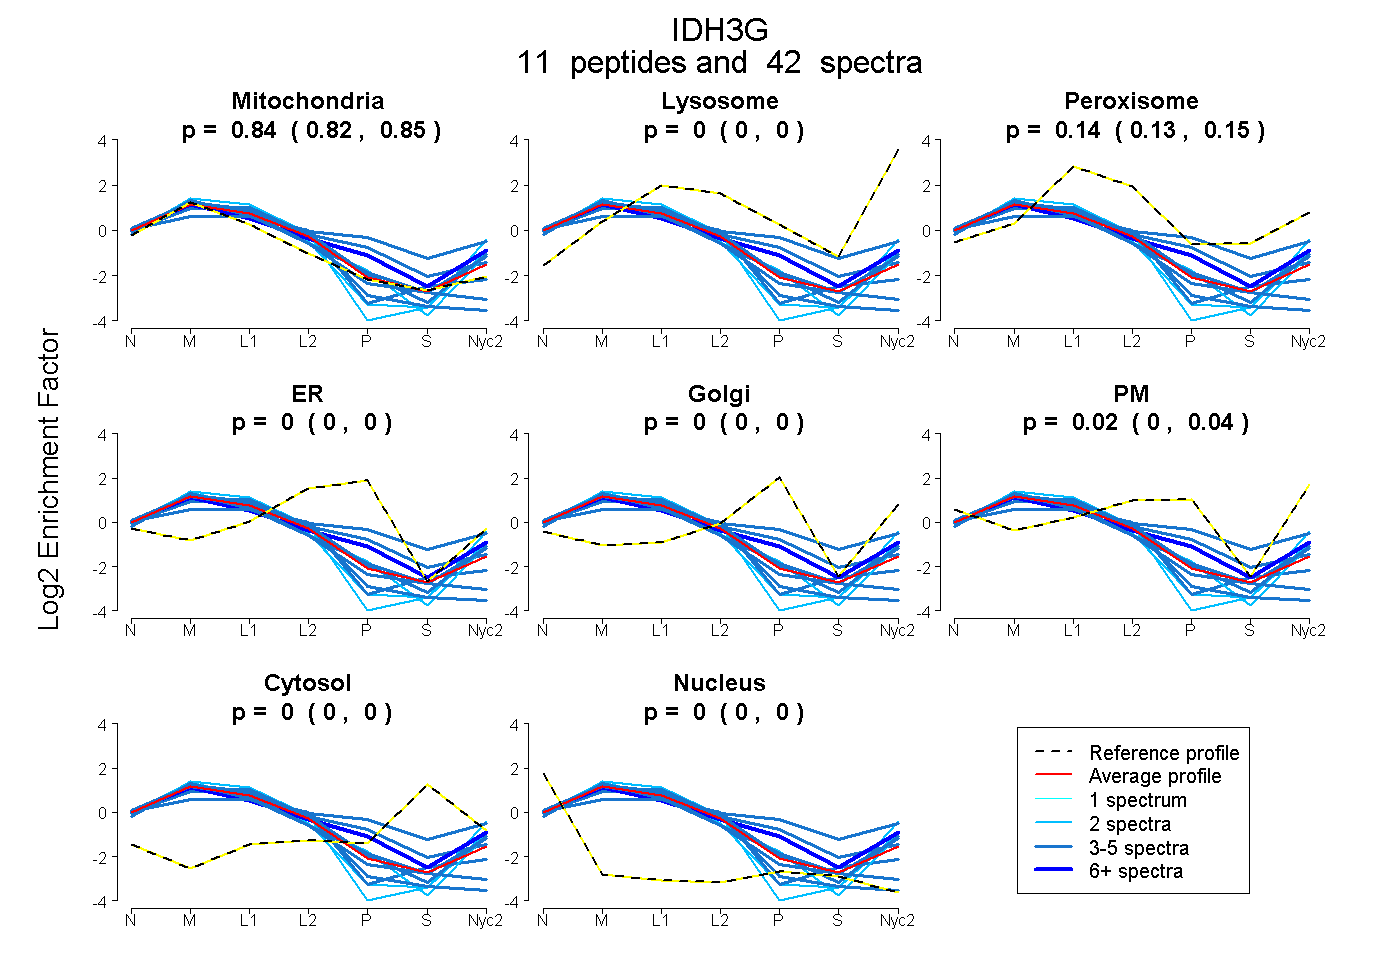
| Expt A |
11 peptides |
42 spectra |
|
0.836 0.821 | 0.849 |
0.000 0.000 | 0.000 |
0.140 0.130 | 0.149 |
0.000 0.000 | 0.000 |
0.000 0.000 | 0.000 |
0.023 0.004 | 0.039 |
0.000 0.000 | 0.000 |
0.000 0.000 | 0.000 |
| 5 spectra, NIANPTATLLASCMMLDHLK | 1.000 | 0.000 | 0.000 | 0.000 | 0.000 | 0.000 | 0.000 | 0.000 | ||
| 5 spectra, LGDGLFLQCCR | 1.000 | 0.000 | 0.000 | 0.000 | 0.000 | 0.000 | 0.000 | 0.000 | ||
| 8 spectra, LAQESGR | 0.681 | 0.008 | 0.065 | 0.000 | 0.000 | 0.245 | 0.000 | 0.000 | ||
| 4 spectra, LHSYATSIR | 0.384 | 0.000 | 0.284 | 0.000 | 0.192 | 0.067 | 0.073 | 0.000 | ||
| 4 spectra, HTVTMIPGDGIGPELMLHVK | 0.930 | 0.000 | 0.070 | 0.000 | 0.000 | 0.000 | 0.000 | 0.000 | ||
| 3 spectra, SLPGVVTR | 0.810 | 0.026 | 0.077 | 0.000 | 0.000 | 0.086 | 0.000 | 0.000 | ||
| 2 spectra, DIDILIVR | 0.918 | 0.082 | 0.000 | 0.000 | 0.000 | 0.000 | 0.000 | 0.000 | ||
| 4 spectra, GNIETNHNLPPSHK | 0.627 | 0.000 | 0.202 | 0.171 | 0.000 | 0.000 | 0.000 | 0.000 | ||
| 2 spectra, IAEYAFK | 0.814 | 0.004 | 0.000 | 0.000 | 0.000 | 0.182 | 0.000 | 0.000 | ||
| 3 spectra, TSLDLYANVIHCK | 0.787 | 0.043 | 0.091 | 0.000 | 0.000 | 0.079 | 0.000 | 0.000 | ||
| 2 spectra, AVLASMDNENMHTPDIGGQGTTSQAIQDIIR | 0.865 | 0.135 | 0.000 | 0.000 | 0.000 | 0.000 | 0.000 | 0.000 |
| Plot | Mito | Lyso or Perox | ER | Golgi | PM | Cytosol | Nucleus | ||||||
| Expt B |
6 peptides |
12 spectra |
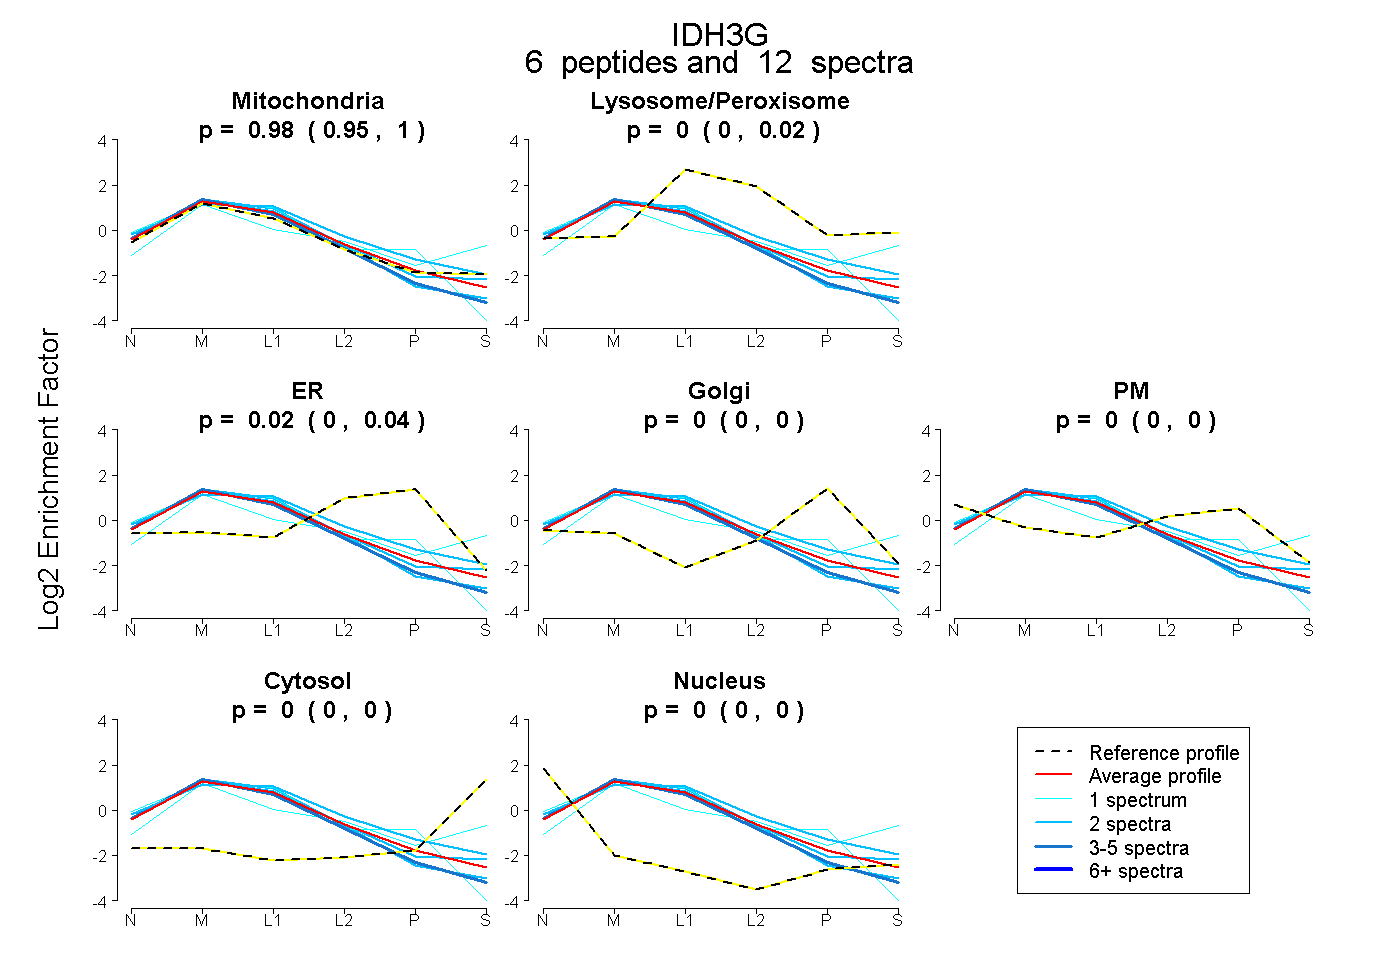 |
0.978 0.949 | 0.998 |
0.000 0.000 | 0.021 |
0.022 0.000 | 0.044 |
0.000 0.000 | 0.000 |
0.000 0.000 | 0.000 |
0.000 0.000 | 0.000 |
0.000 0.000 | 0.000 |
|||
| Plot | Lyso | Other | |||||||||||
| Expt C |
11 peptides |
98 spectra |
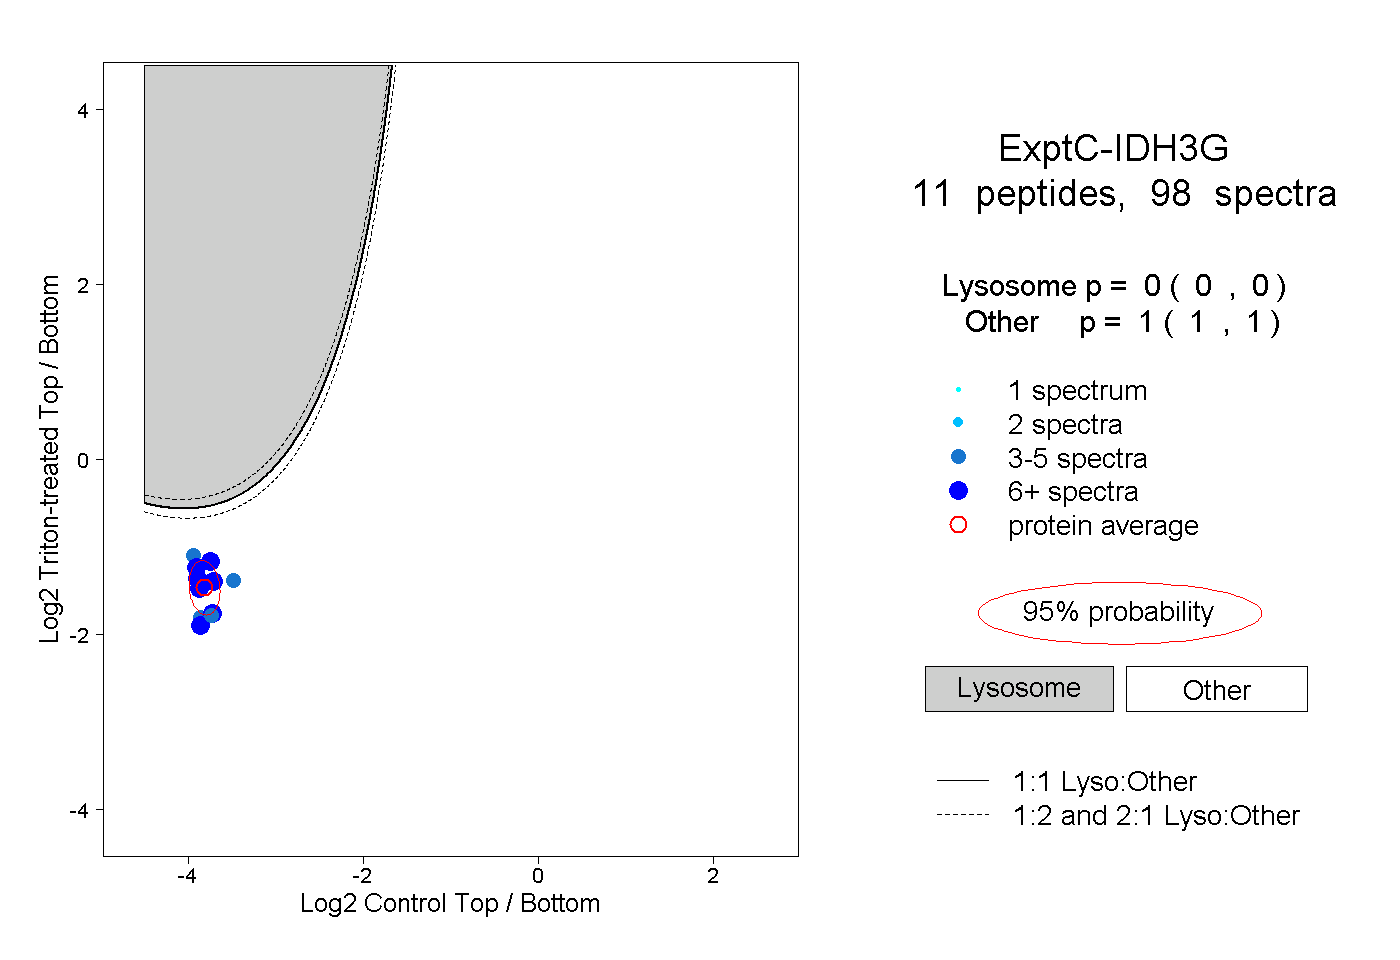 |
0.000 0.000 | 0.000 |
1.000 1.000 | 1.000 |
||||||||
| Plot | Lyso | Other | |||||||||||
| Expt D |
4 peptides |
14 spectra |
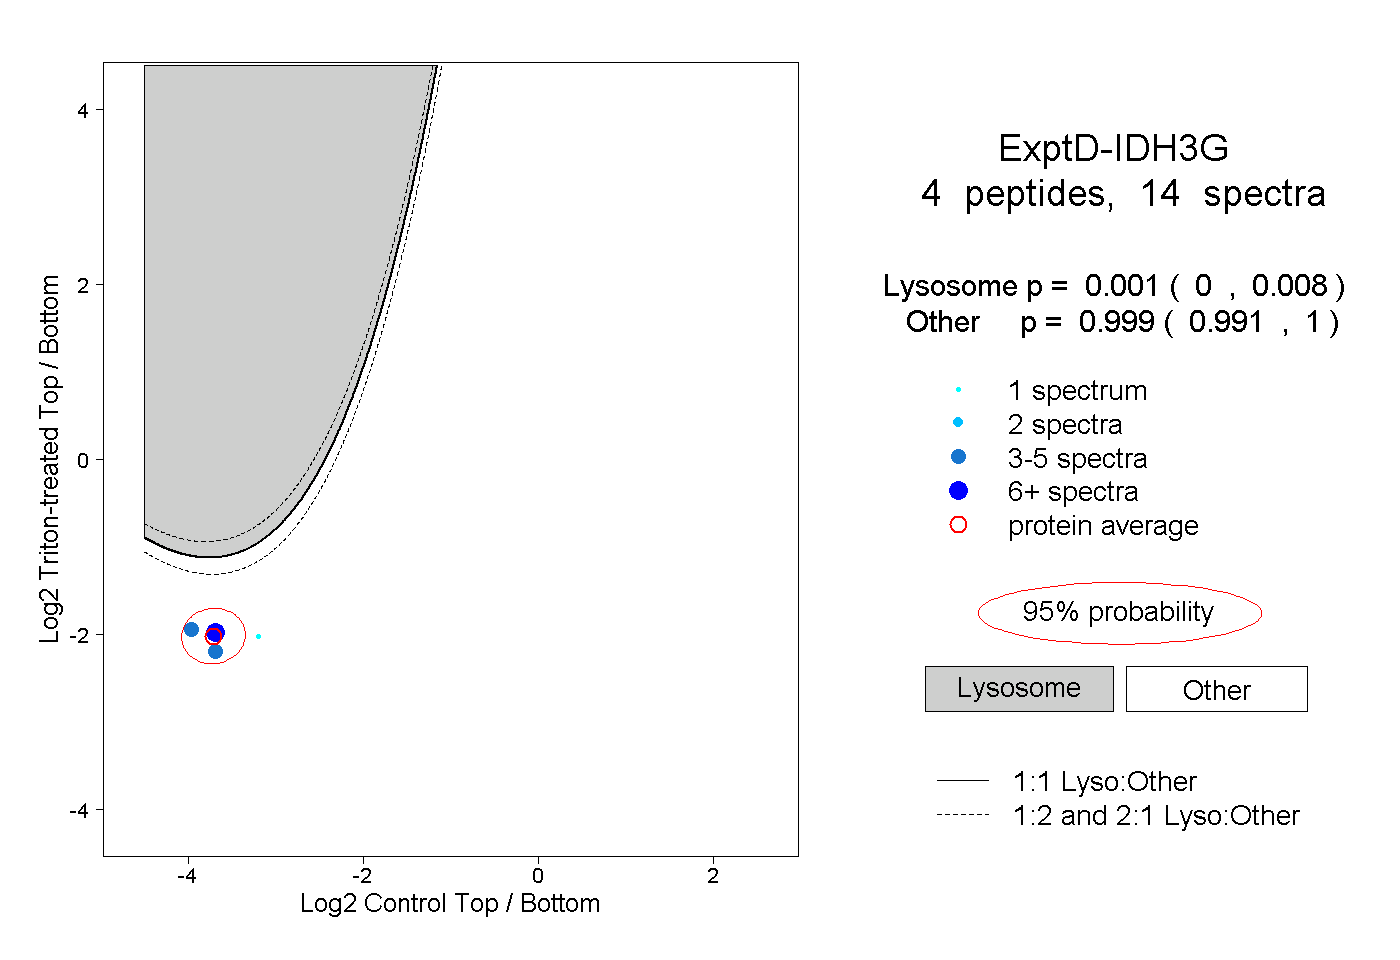 |
0.001 0.000 | 0.008 |
0.999 0.991 | 1.000 |