 3
3peptides
spectra
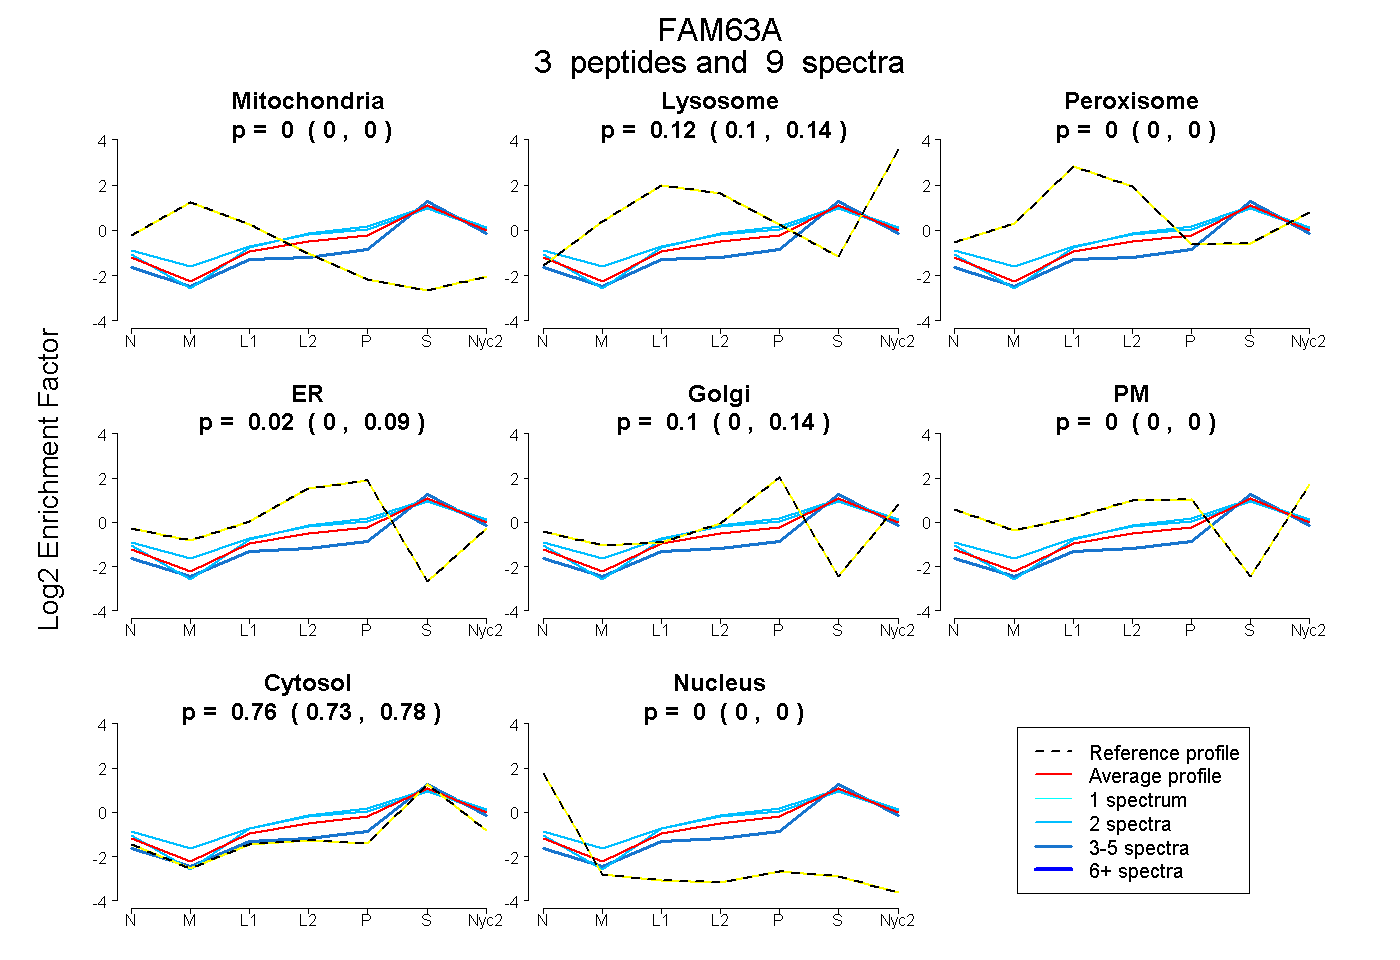
0.000 | 0.000
0.098 | 0.143
0.000 | 0.000
0.000 | 0.090
0.003 | 0.144
0.000 | 0.000
0.731 | 0.777
0.000 | 0.000
1peptide
spectra
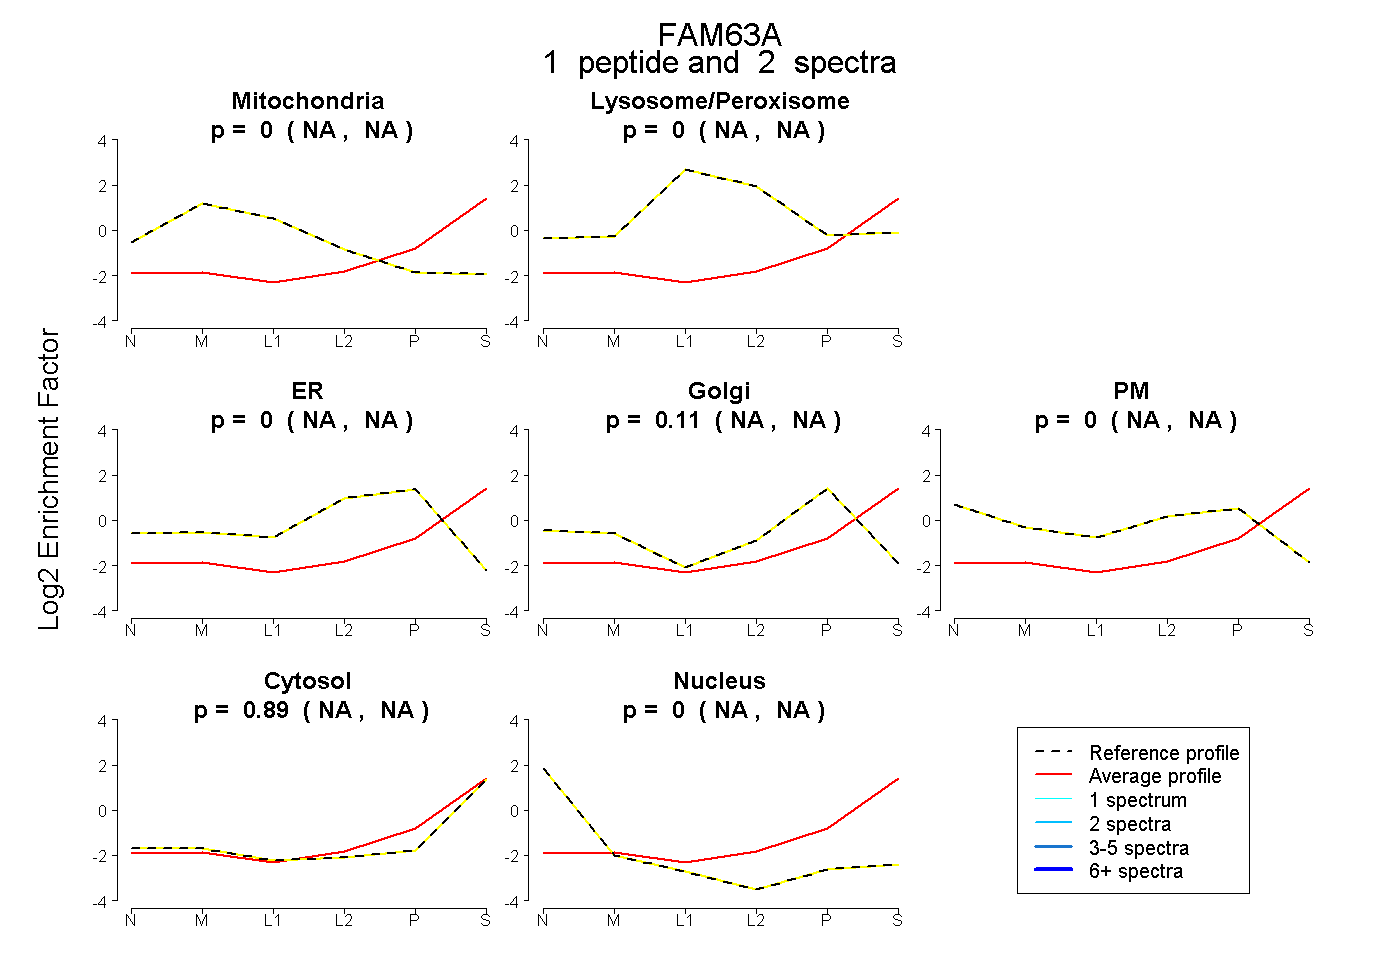
NA | NA
NA | NA
NA | NA
NA | NA
NA | NA
NA | NA
NA | NA
5peptides
spectra
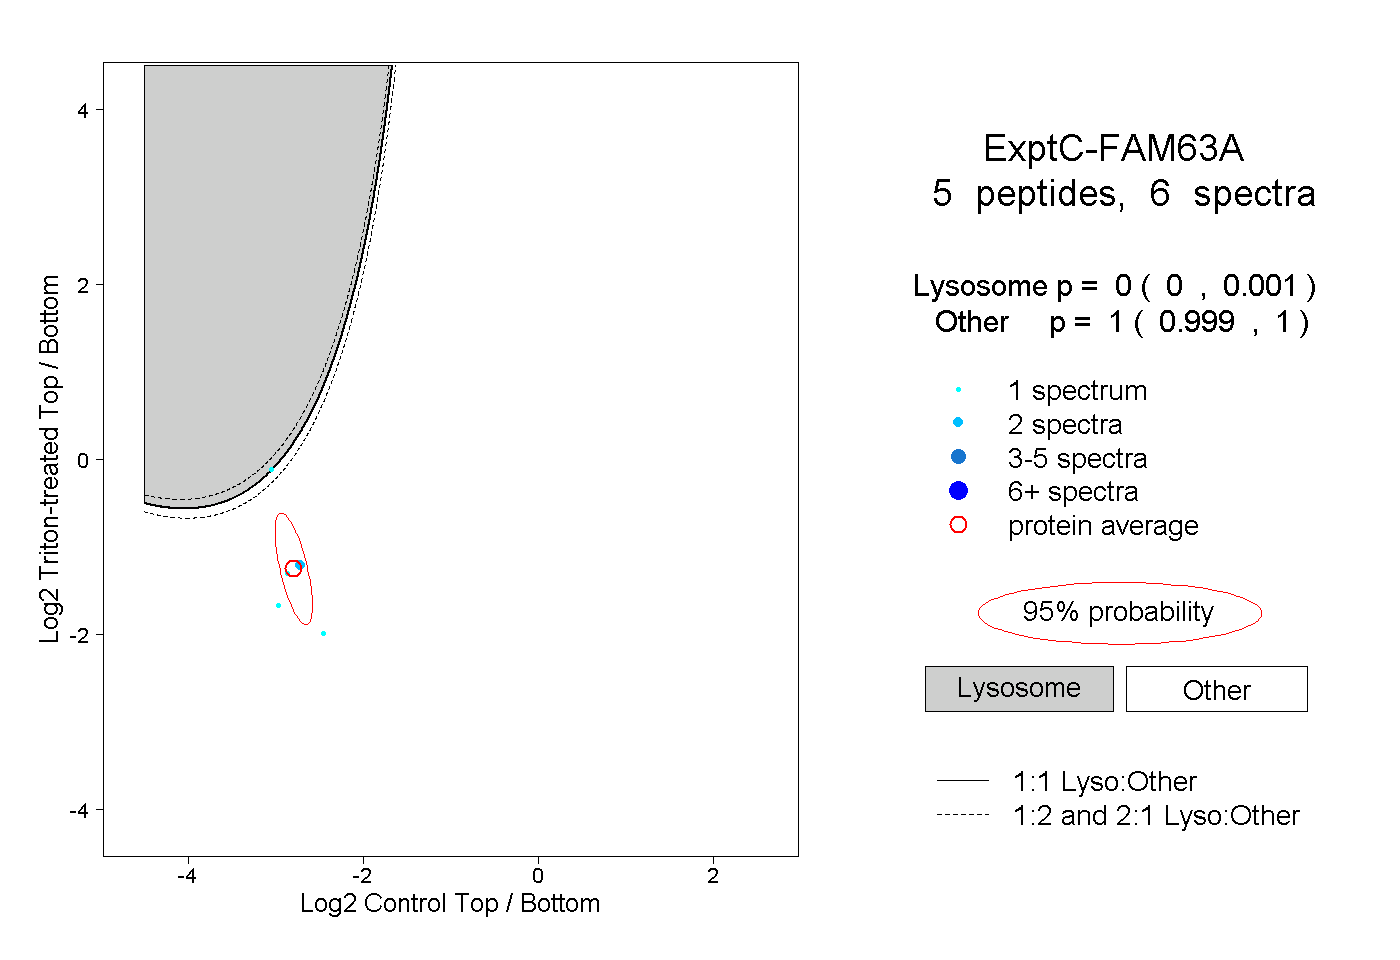
0.000 | 0.001
0.999 | 1.000