 3
3peptides
spectra
0.000 | 0.000
0.098 | 0.143
0.000 | 0.000
0.000 | 0.090
0.003 | 0.144
0.000 | 0.000
0.731 | 0.777
0.000 | 0.000
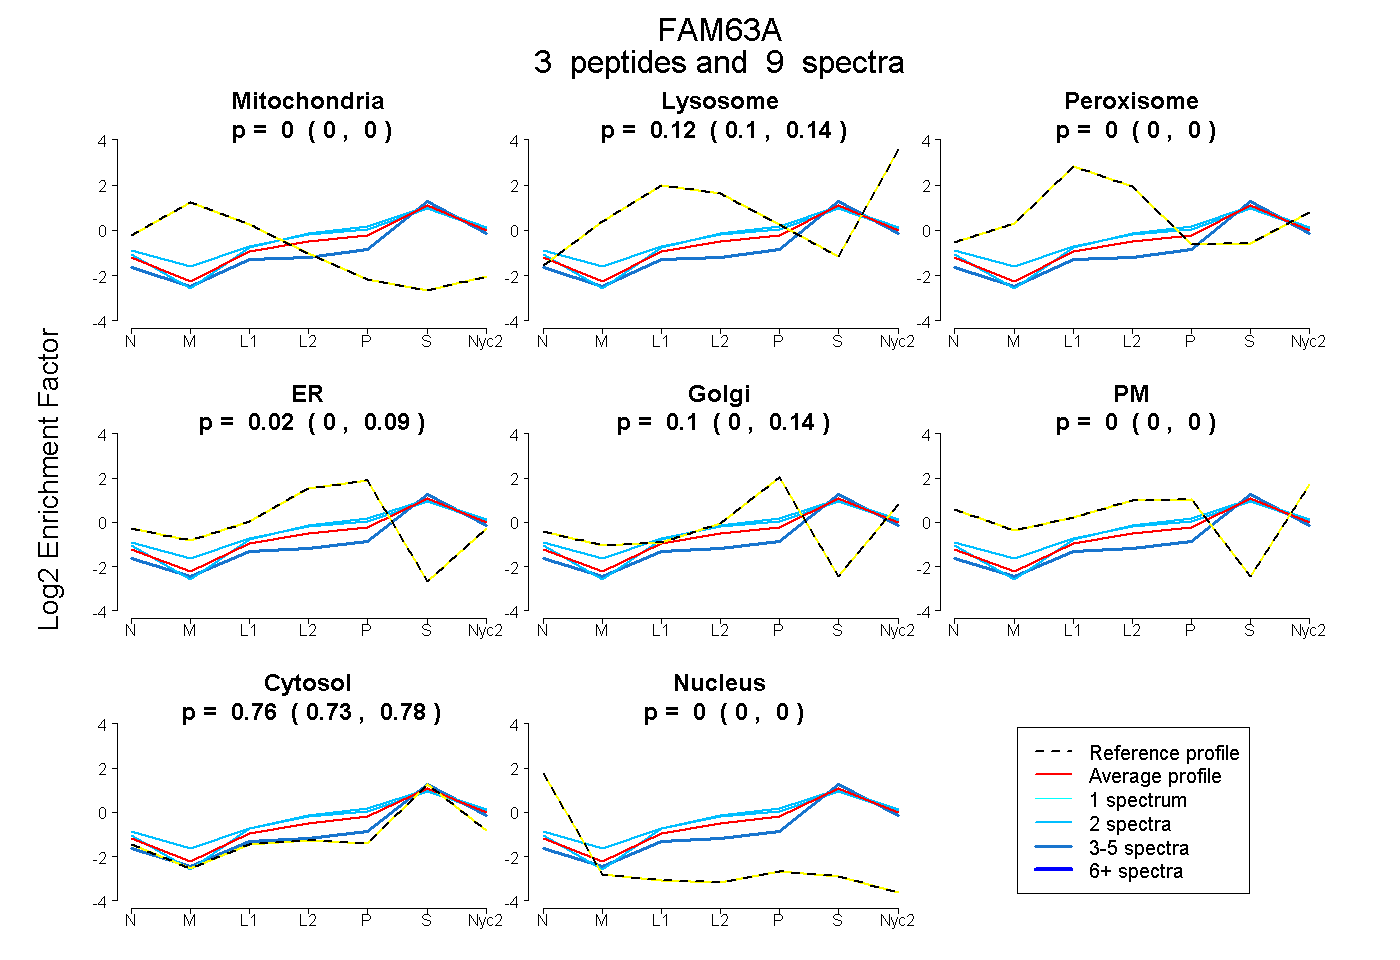
| Plot | Mito | Lyso | Perox | ER | Golgi | PM | Cytosol | Nucleus | |||||
| Expt A |
3 peptides |
9 spectra |
|
0.000 0.000 | 0.000 |
0.122 0.098 | 0.143 |
0.000 0.000 | 0.000 |
0.024 0.000 | 0.090 |
0.098 0.003 | 0.144 |
0.000 0.000 | 0.000 |
0.756 0.731 | 0.777 |
0.000 0.000 | 0.000 |
| 2 spectra, GATSGRPAGER | 0.000 | 0.122 | 0.000 | 0.116 | 0.060 | 0.000 | 0.702 | 0.000 | ||
| 2 spectra, APSSPGR | 0.000 | 0.117 | 0.060 | 0.076 | 0.106 | 0.000 | 0.641 | 0.000 | ||
| 5 spectra, EDELSVFFR | 0.000 | 0.078 | 0.000 | 0.000 | 0.016 | 0.000 | 0.906 | 0.000 |
| Plot | Mito | Lyso or Perox | ER | Golgi | PM | Cytosol | Nucleus | ||||||
| Expt B |
1 peptide |
2 spectra |
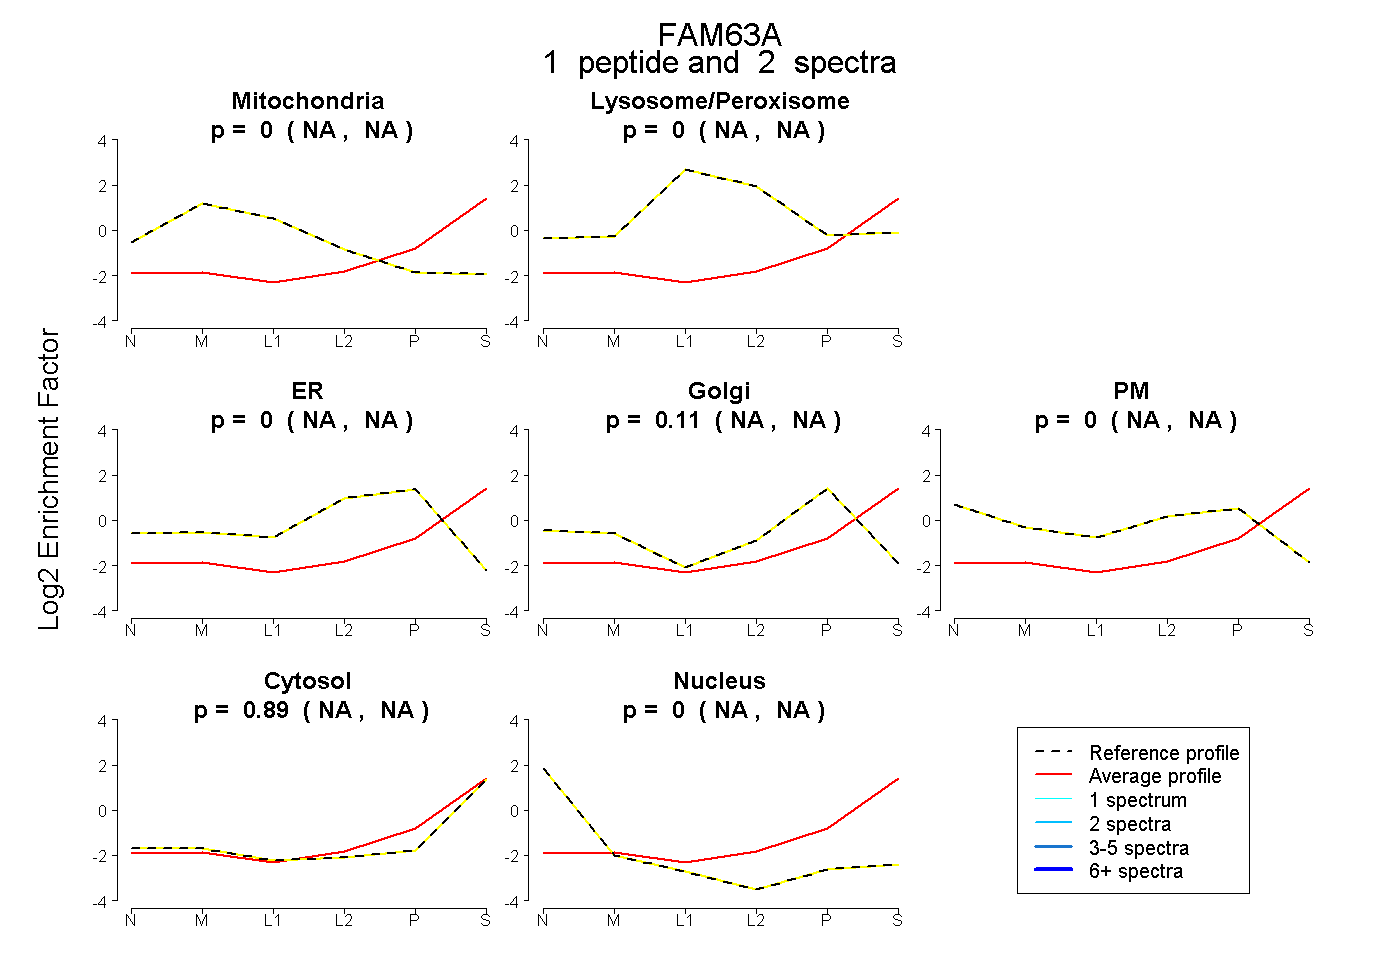 |
0.000 NA | NA |
0.000 NA | NA |
0.000 NA | NA |
0.111 NA | NA |
0.000 NA | NA |
0.889 NA | NA |
0.000 NA | NA |
|||
| Plot | Lyso | Other | |||||||||||
| Expt C |
5 peptides |
6 spectra |
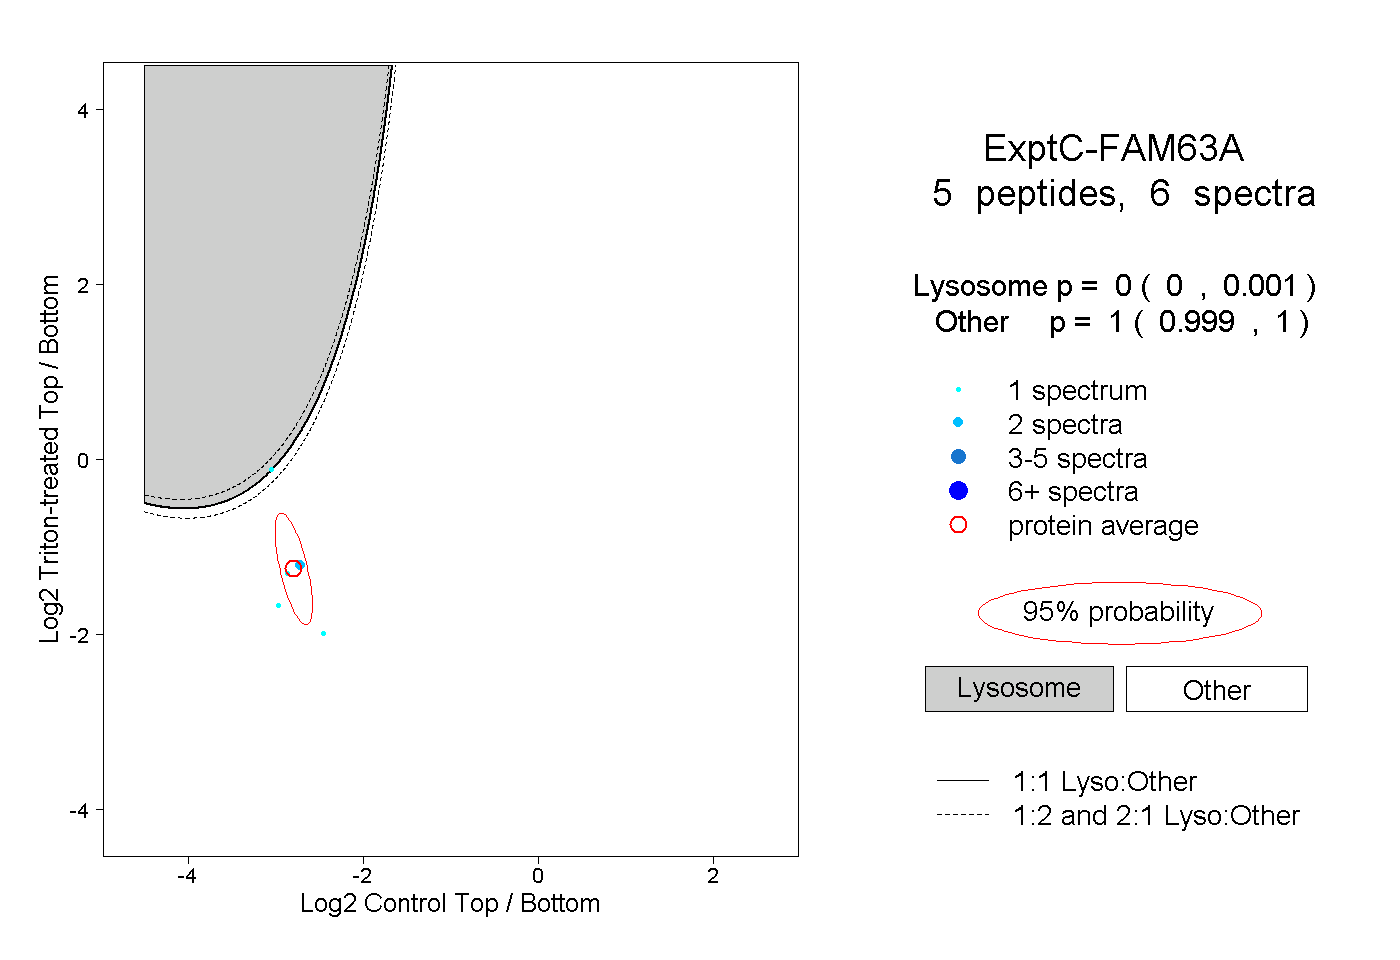 |
0.000 0.000 | 0.001 |
1.000 0.999 | 1.000 |