 2
2peptides
spectra
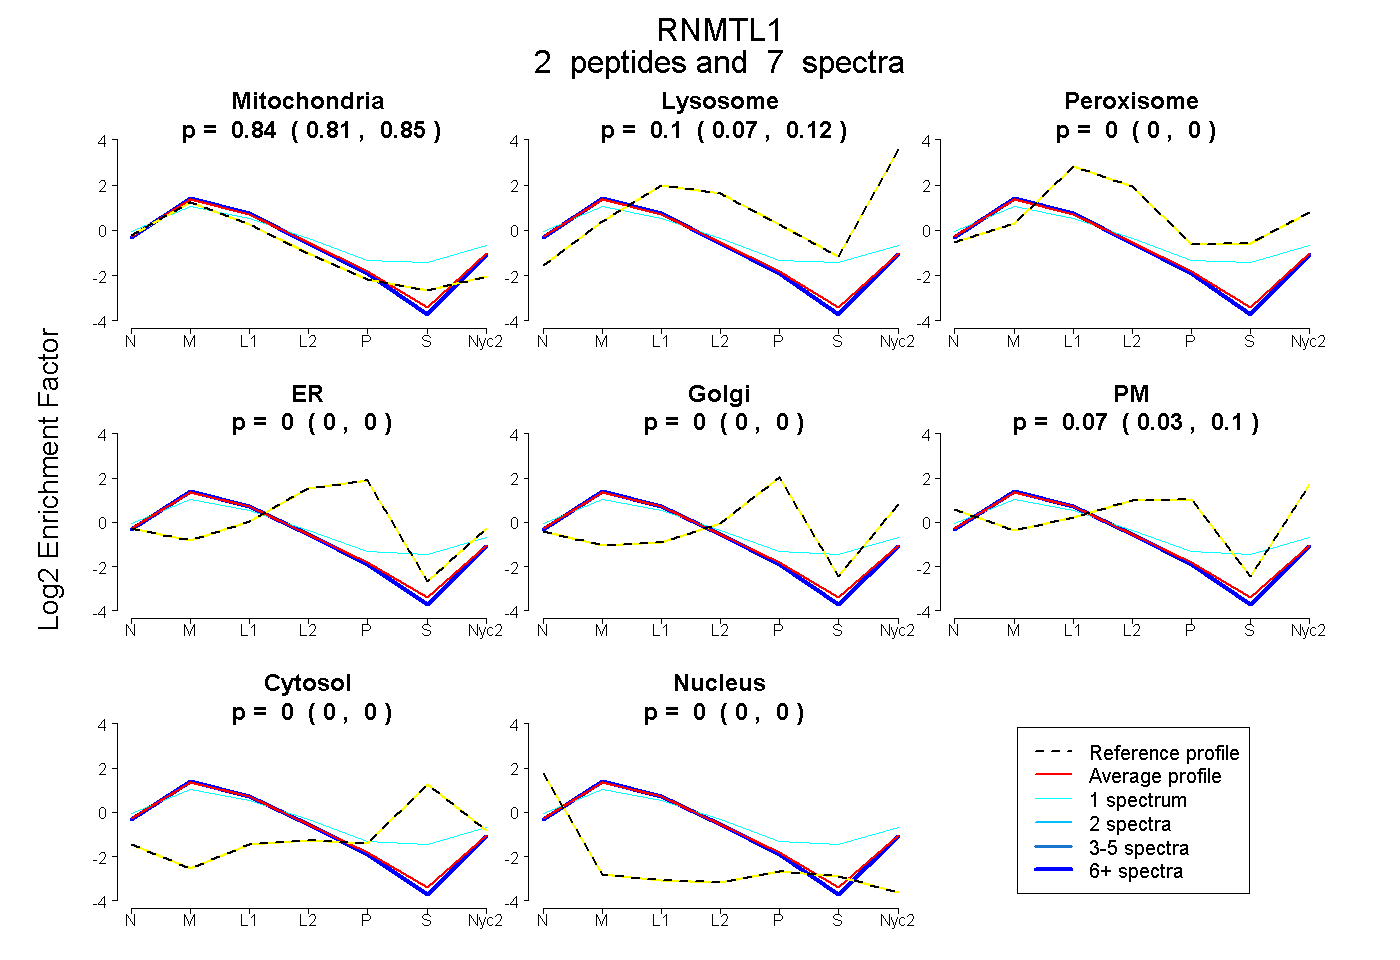
0.815 | 0.852
0.067 | 0.123
0.000 | 0.000
0.000 | 0.000
0.000 | 0.000
0.028 | 0.102
0.000 | 0.000
0.000 | 0.000
9peptides
spectra
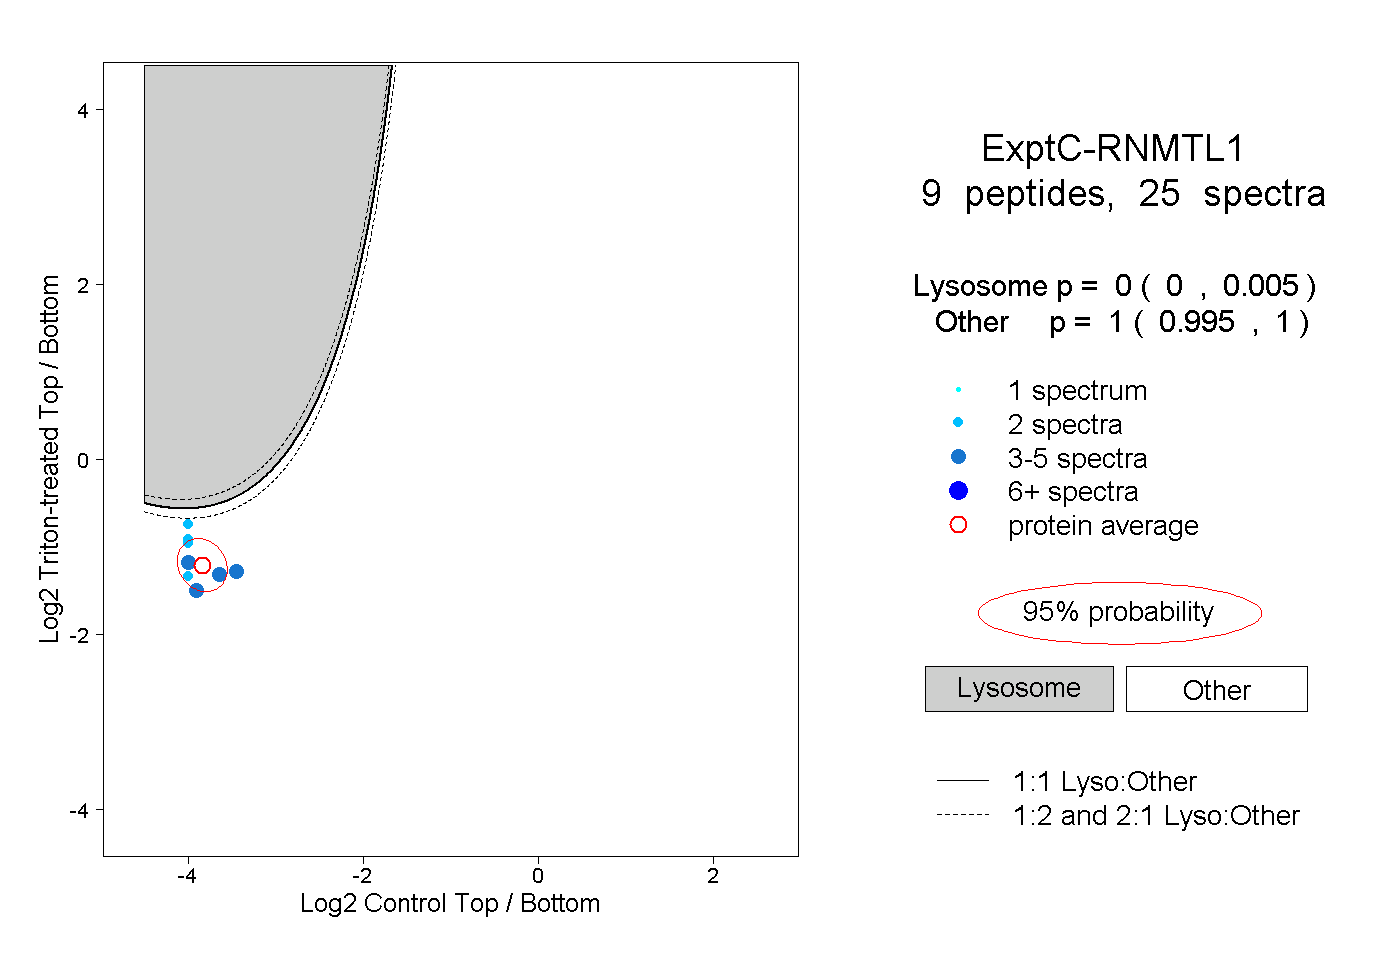
0.000 | 0.005
0.995 | 1.000
1peptide
spectrum

NA | NA
NA | NA