 2
2peptides
spectra
0.815 | 0.852
0.067 | 0.123
0.000 | 0.000
0.000 | 0.000
0.000 | 0.000
0.028 | 0.102
0.000 | 0.000
0.000 | 0.000
9peptides
spectra
0.000 | 0.005
0.995 | 1.000
| Plot | Mito | Lyso | Perox | ER | Golgi | PM | Cytosol | Nucleus | |||||
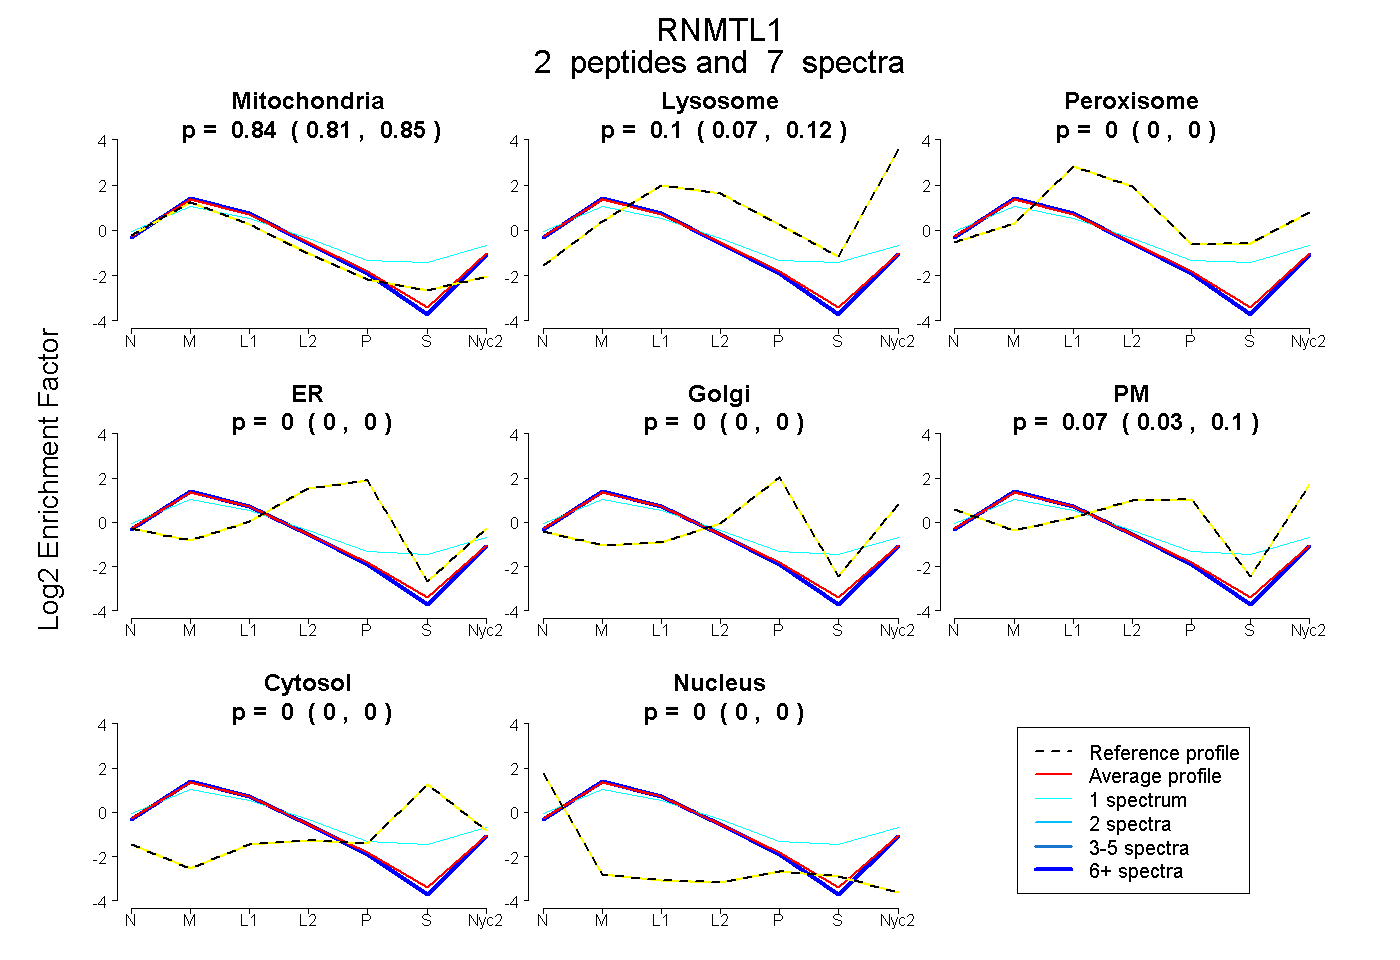
| Expt A |
2 peptides |
7 spectra |
|
0.835 0.815 | 0.852 |
0.098 0.067 | 0.123 |
0.000 0.000 | 0.000 |
0.000 0.000 | 0.000 |
0.000 0.000 | 0.000 |
0.067 0.028 | 0.102 |
0.000 0.000 | 0.000 |
0.000 0.000 | 0.000 |
||
| Plot | Lyso | Other | |||||||||||
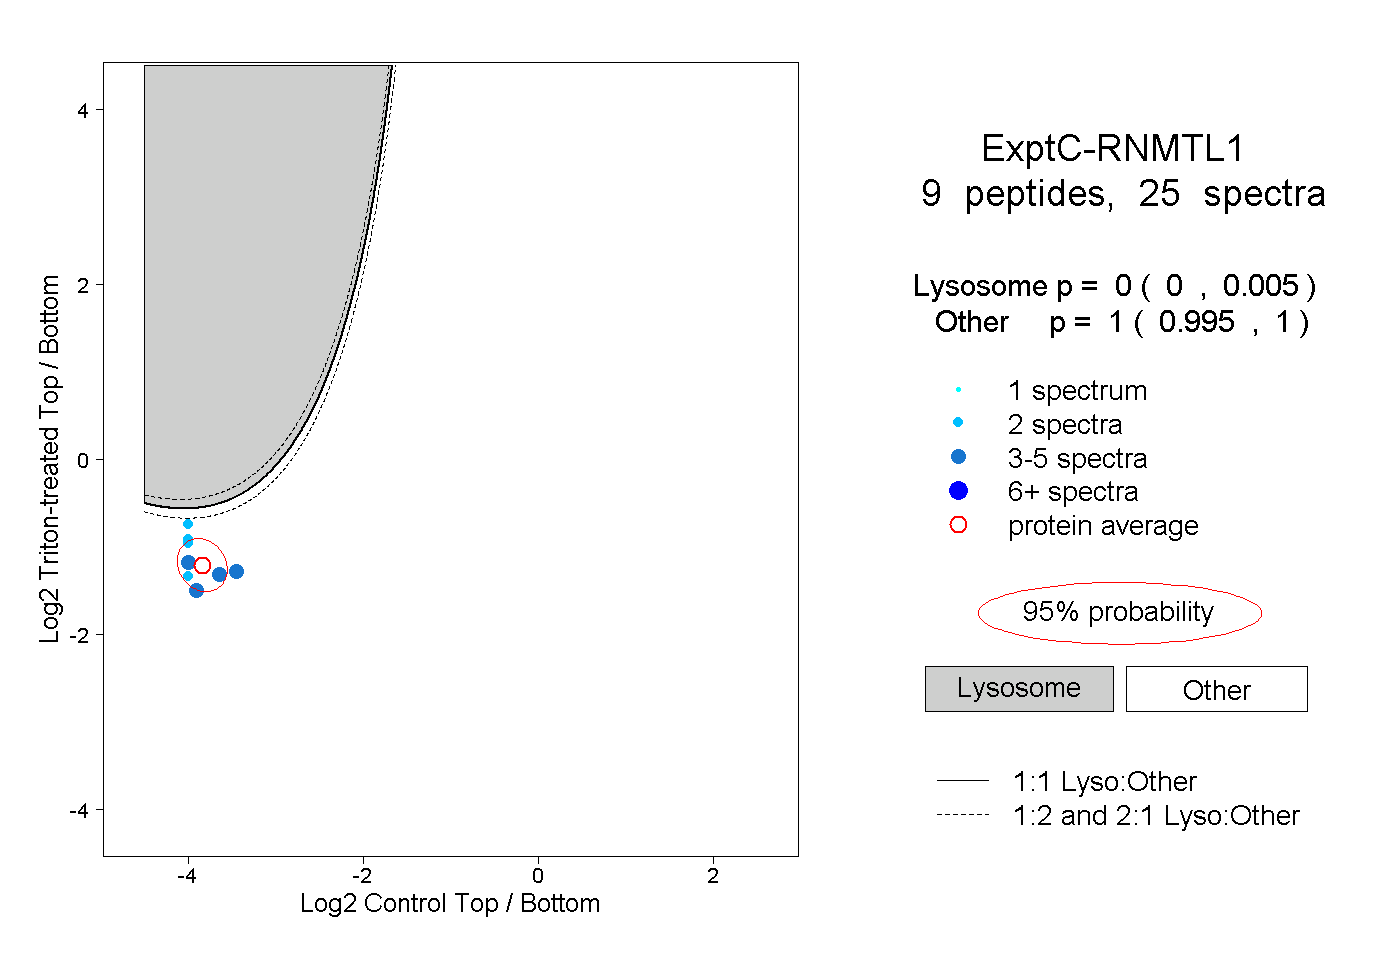
| Expt C |
9 peptides |
25 spectra |
|
0.000 0.000 | 0.005 |
1.000 0.995 | 1.000 |
| 4 spectra, SAAGAGCSK | 0.000 | 1.000 | ||||||||
| 2 spectra, LLIEGR | 0.000 | 1.000 | ||||||||
| 1 spectrum, GVSLIK | 0.000 | 1.000 | ||||||||
| 2 spectra, ELPVDK | 0.095 | 0.905 | ||||||||
| 2 spectra, LIADALK | 0.011 | 0.989 | ||||||||
| 4 spectra, VLFPSGQVEER | 0.000 | 1.000 | ||||||||
| 2 spectra, DPGNLGTILR | 0.006 | 0.994 | ||||||||
| 4 spectra, AGAVPK | 0.000 | 1.000 | ||||||||
| 4 spectra, LSSVMTIVK | 0.000 | 1.000 |
| Plot | Lyso | Other | |||||||||||
| Expt D |
1 peptide |
1 spectrum |
 |
0.001 NA | NA |
0.999 NA | NA |