 12
12peptides
spectra
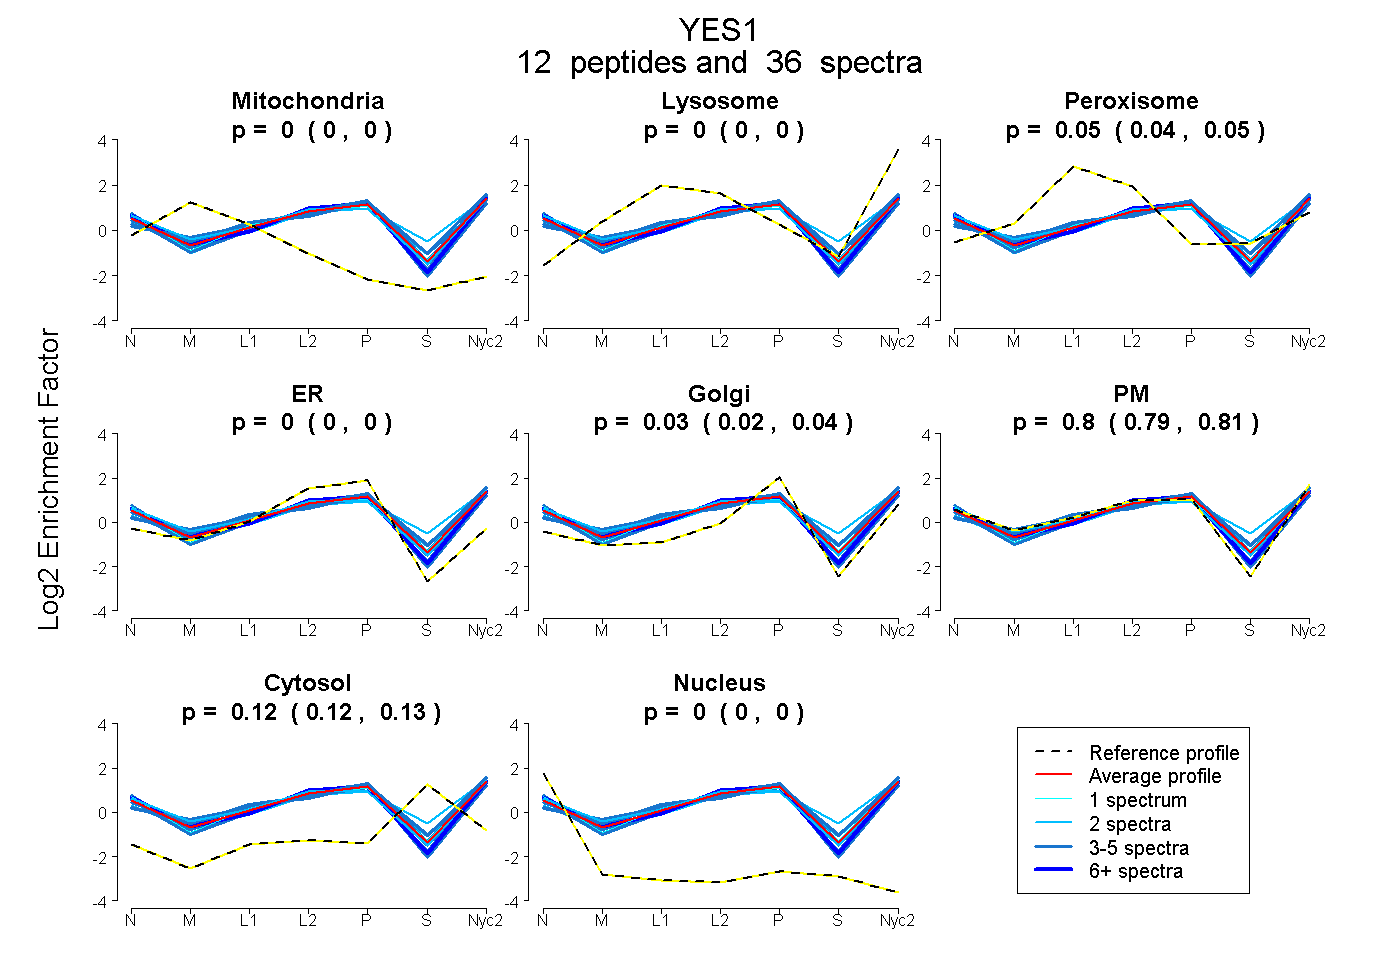
0.000 | 0.000
0.000 | 0.000
0.040 | 0.051
0.000 | 0.000
0.018 | 0.038
0.792 | 0.814
0.116 | 0.125
0.000 | 0.000
3peptides
spectra
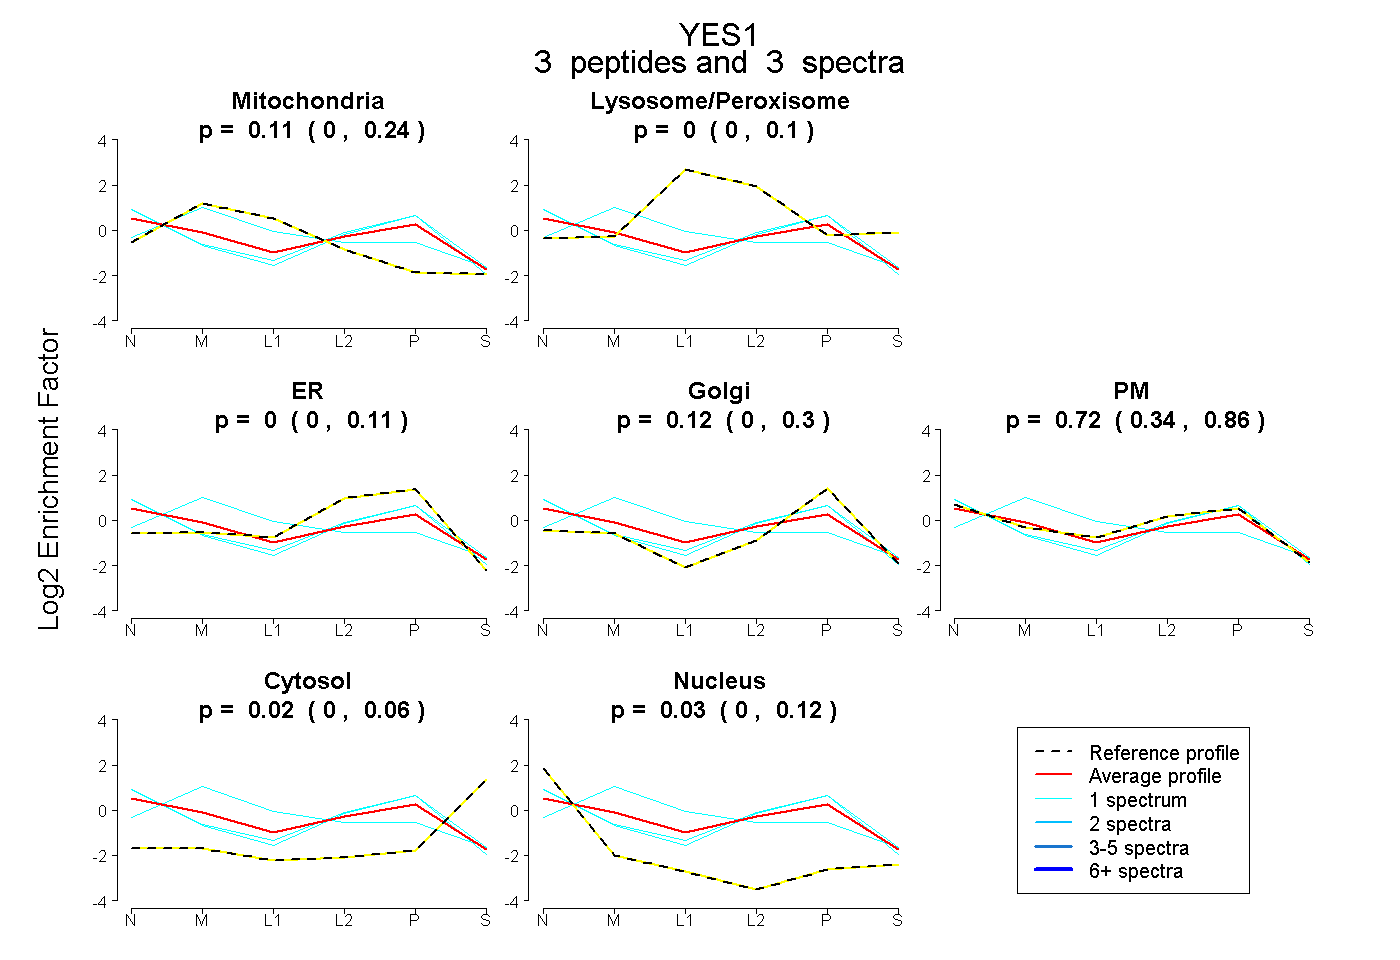
0.000 | 0.239
0.000 | 0.099
0.000 | 0.114
0.000 | 0.303
0.335 | 0.859
0.000 | 0.063
0.000 | 0.122
14peptides
spectra
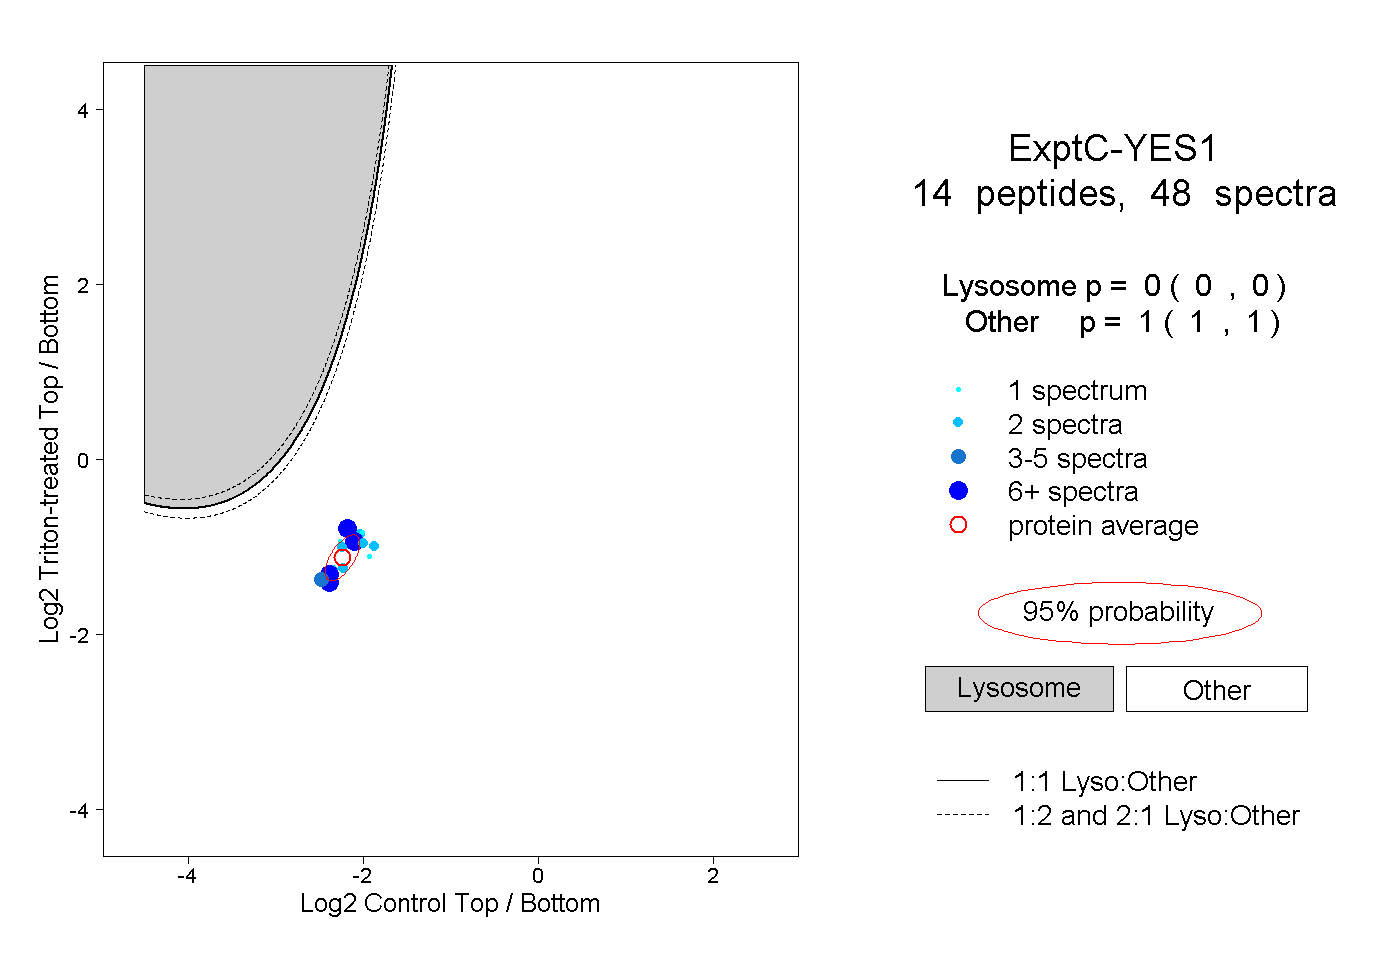
0.000 | 0.000
1.000 | 1.000
4peptides
spectra
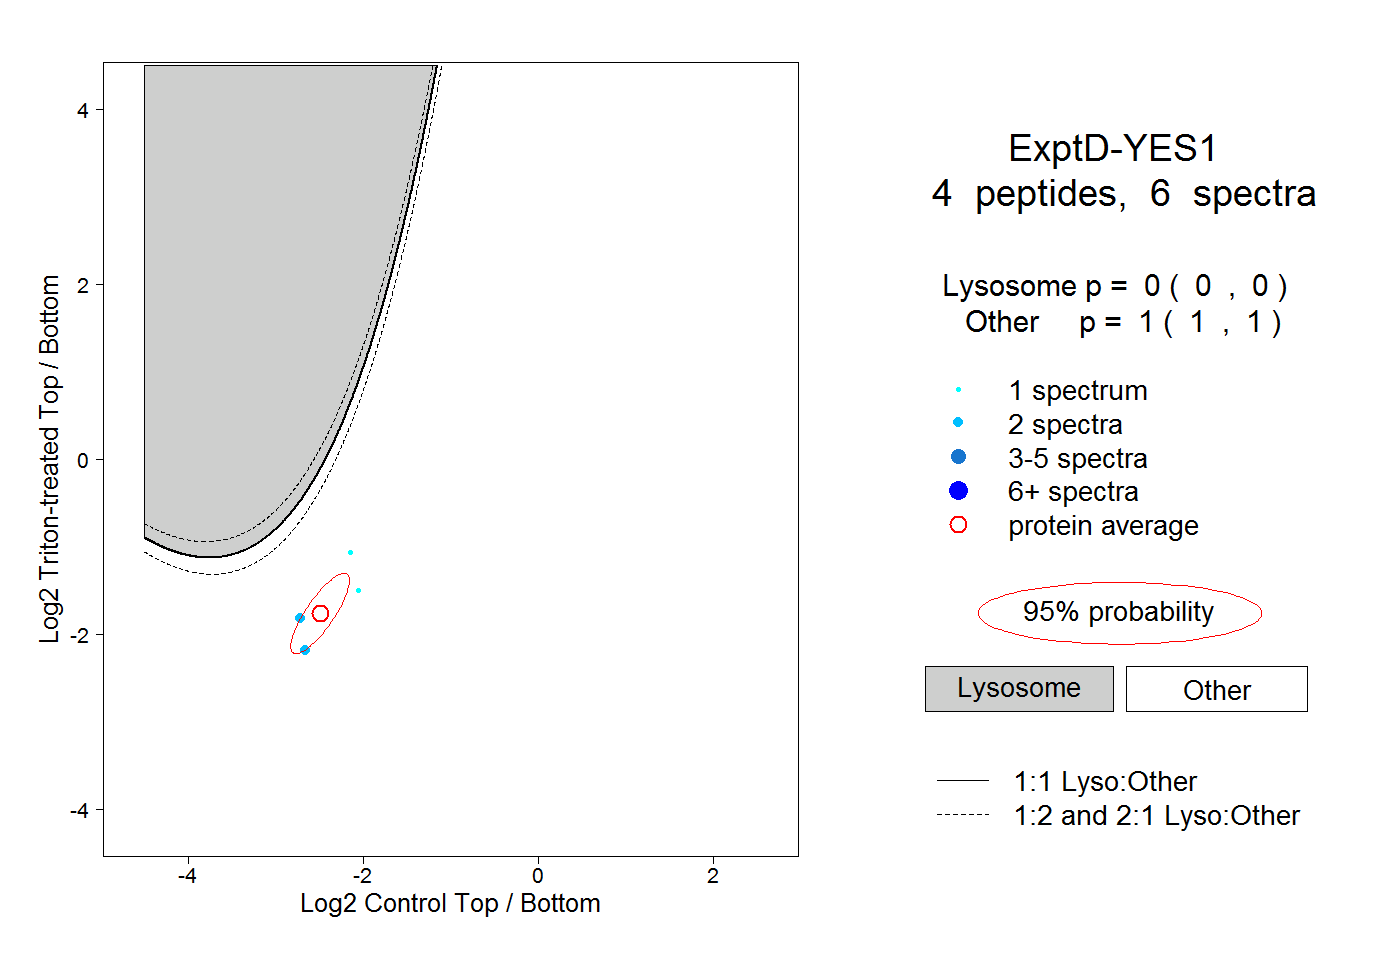
0.000 | 0.000
1.000 | 1.000