 12
12peptides
spectra
0.000 | 0.000
0.000 | 0.000
0.040 | 0.051
0.000 | 0.000
0.018 | 0.038
0.792 | 0.814
0.116 | 0.125
0.000 | 0.000
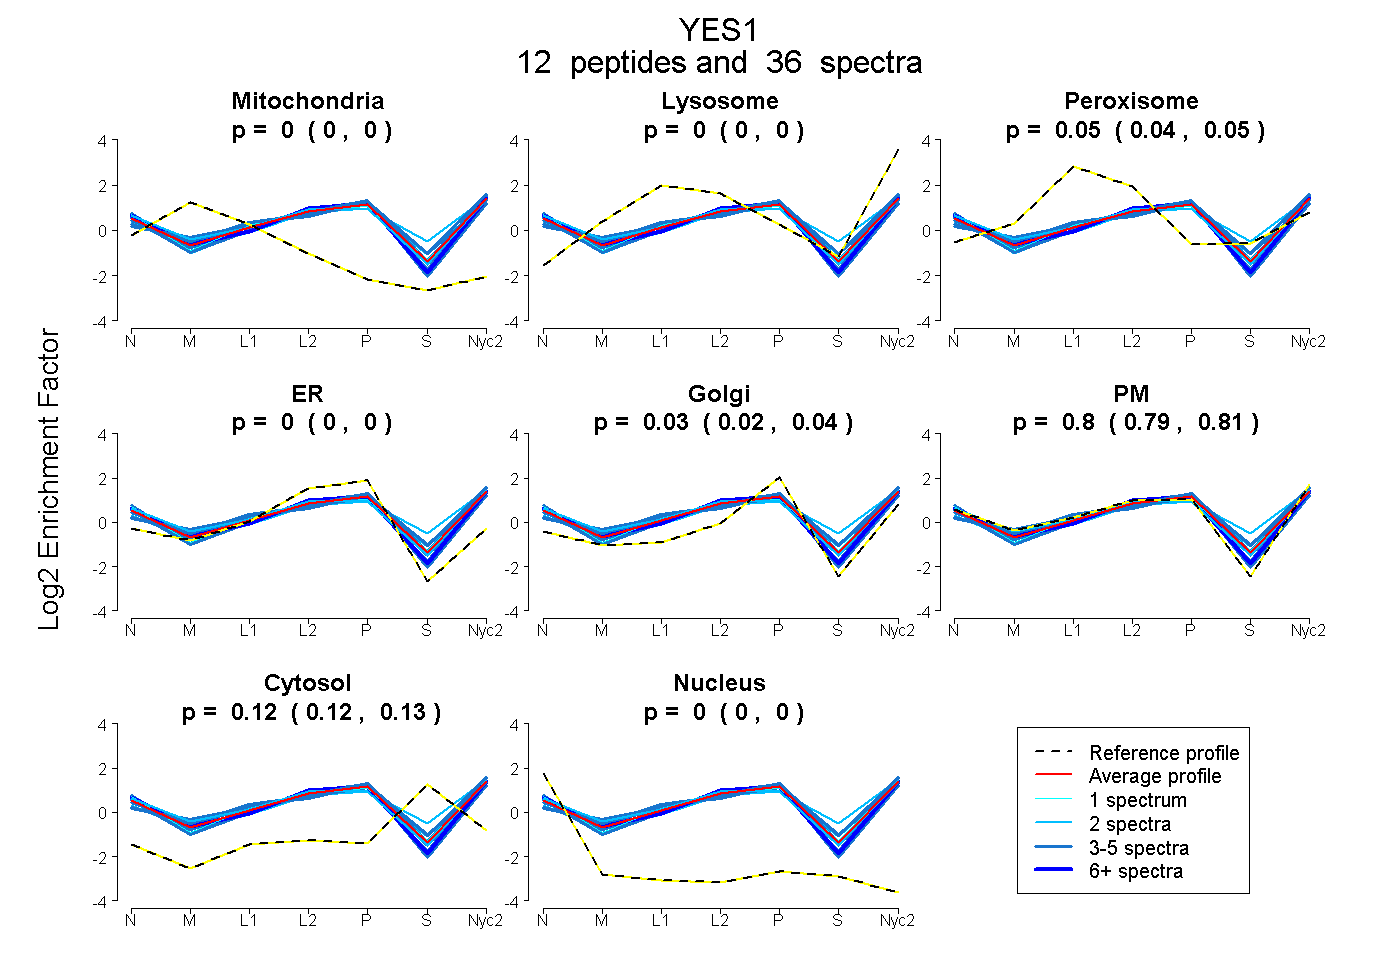
| Plot | Mito | Lyso | Perox | ER | Golgi | PM | Cytosol | Nucleus | |||||
| Expt A |
12 peptides |
36 spectra |
|
0.000 0.000 | 0.000 |
0.000 0.000 | 0.000 |
0.046 0.040 | 0.051 |
0.000 0.000 | 0.000 |
0.029 0.018 | 0.038 |
0.804 0.792 | 0.814 |
0.121 0.116 | 0.125 |
0.000 0.000 | 0.000 |
| 3 spectra, FQIINNTEGDWWEAR | 0.000 | 0.018 | 0.000 | 0.000 | 0.000 | 0.861 | 0.121 | 0.000 | ||
| 2 spectra, AQFDTLQK | 0.000 | 0.119 | 0.000 | 0.000 | 0.000 | 0.637 | 0.244 | 0.000 | ||
| 1 spectrum, SDVWSFGILQTELVTK | 0.000 | 0.000 | 0.050 | 0.000 | 0.000 | 0.811 | 0.139 | 0.000 | ||
| 3 spectra, GIFLVR | 0.000 | 0.000 | 0.029 | 0.057 | 0.000 | 0.731 | 0.184 | 0.000 | ||
| 3 spectra, VPYPGMVNR | 0.000 | 0.131 | 0.071 | 0.000 | 0.164 | 0.522 | 0.112 | 0.000 | ||
| 2 spectra, WTAPEAALYGR | 0.000 | 0.000 | 0.063 | 0.000 | 0.000 | 0.839 | 0.098 | 0.000 | ||
| 4 spectra, MNYIHR | 0.000 | 0.064 | 0.139 | 0.000 | 0.267 | 0.472 | 0.058 | 0.000 | ||
| 2 spectra, ESETTK | 0.000 | 0.000 | 0.028 | 0.000 | 0.000 | 0.791 | 0.181 | 0.000 | ||
| 3 spectra, GAYSLSIR | 0.000 | 0.002 | 0.044 | 0.000 | 0.003 | 0.882 | 0.070 | 0.000 | ||
| 3 spectra, DWDEVR | 0.000 | 0.003 | 0.089 | 0.000 | 0.107 | 0.722 | 0.079 | 0.000 | ||
| 6 spectra, LLLNPGNQR | 0.000 | 0.000 | 0.000 | 0.060 | 0.004 | 0.862 | 0.074 | 0.000 | ||
| 4 spectra, EVLEQVER | 0.000 | 0.000 | 0.000 | 0.132 | 0.029 | 0.770 | 0.059 | 0.010 |
| Plot | Mito | Lyso or Perox | ER | Golgi | PM | Cytosol | Nucleus | ||||||
| Expt B |
3 peptides |
3 spectra |
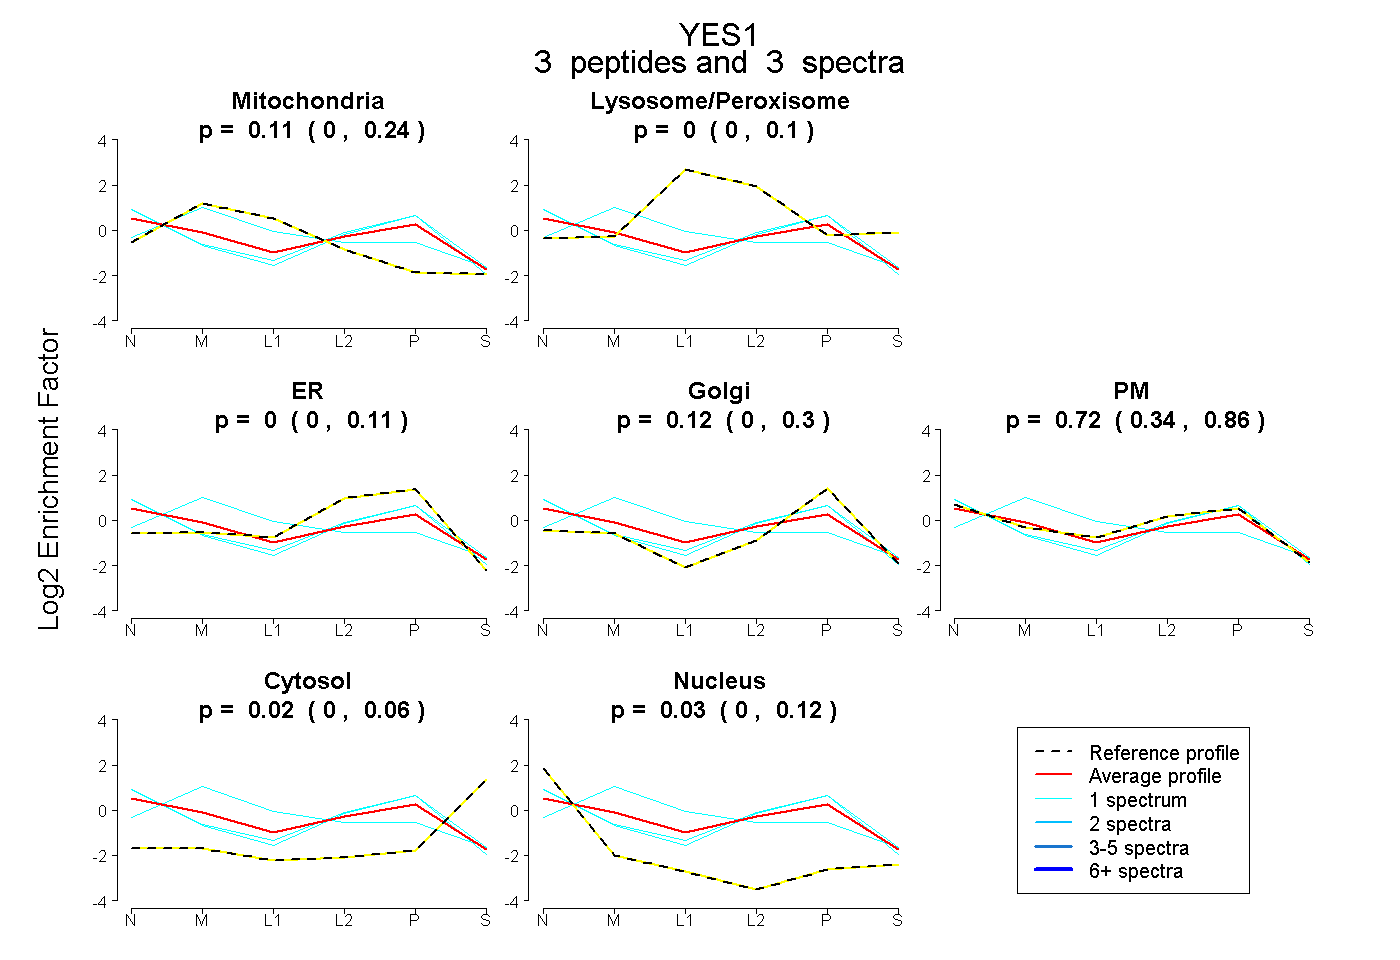 |
0.109 0.000 | 0.239 |
0.000 0.000 | 0.099 |
0.000 0.000 | 0.114 |
0.123 0.000 | 0.303 |
0.718 0.335 | 0.859 |
0.019 0.000 | 0.063 |
0.030 0.000 | 0.122 |
|||
| Plot | Lyso | Other | |||||||||||
| Expt C |
14 peptides |
48 spectra |
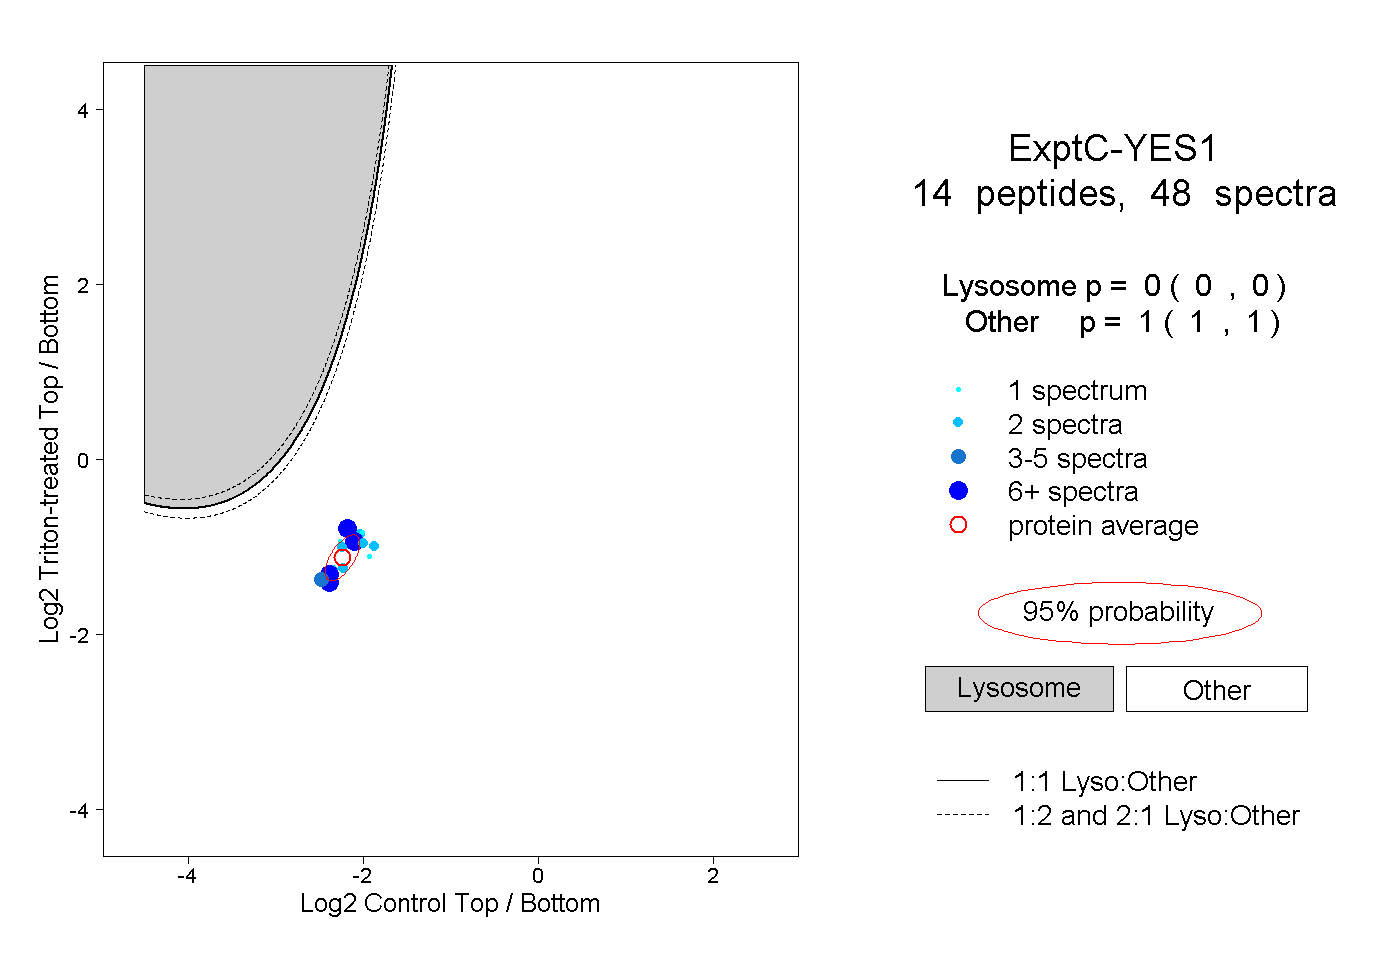 |
0.000 0.000 | 0.000 |
1.000 1.000 | 1.000 |
||||||||
| Plot | Lyso | Other | |||||||||||
| Expt D |
4 peptides |
6 spectra |
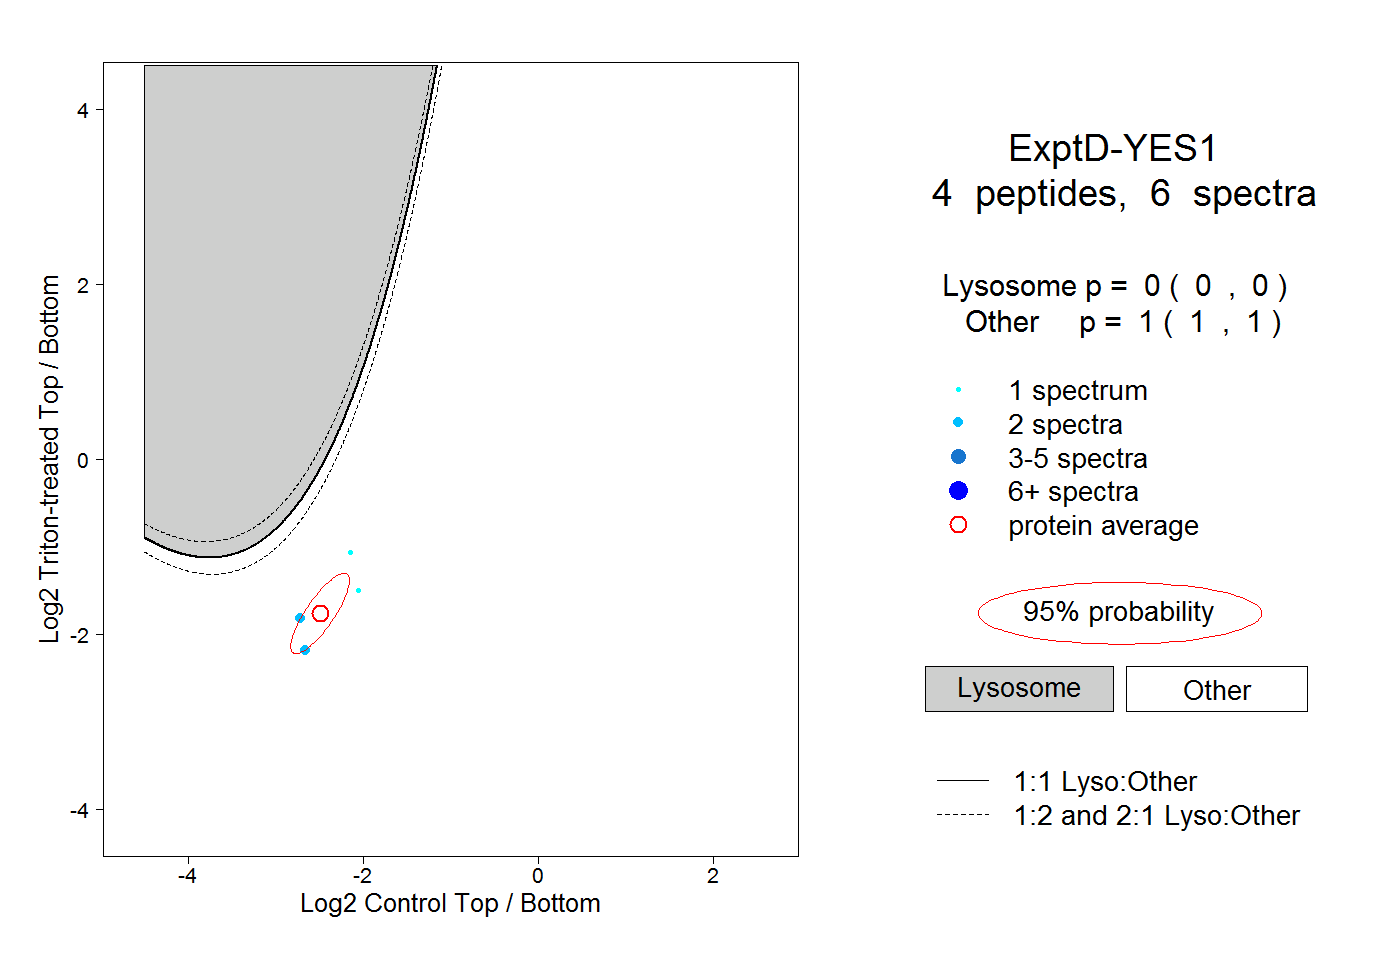 |
0.000 0.000 | 0.000 |
1.000 1.000 | 1.000 |