 15
15peptides
spectra
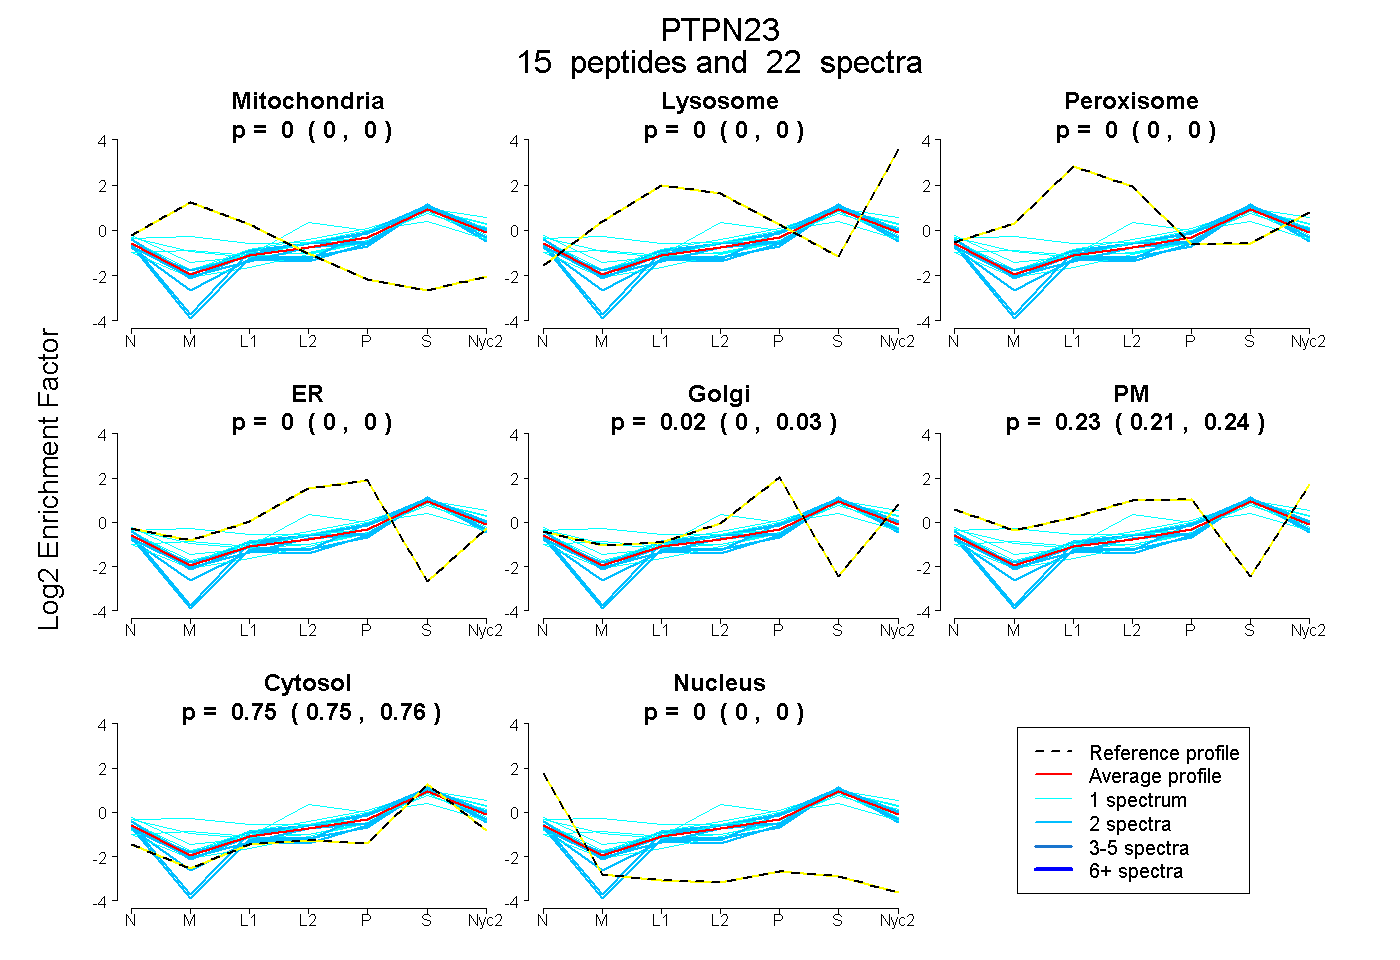
0.000 | 0.000
0.000 | 0.000
0.000 | 0.000
0.000 | 0.000
0.005 | 0.031
0.211 | 0.241
0.748 | 0.759
0.000 | 0.000
5peptides
spectra
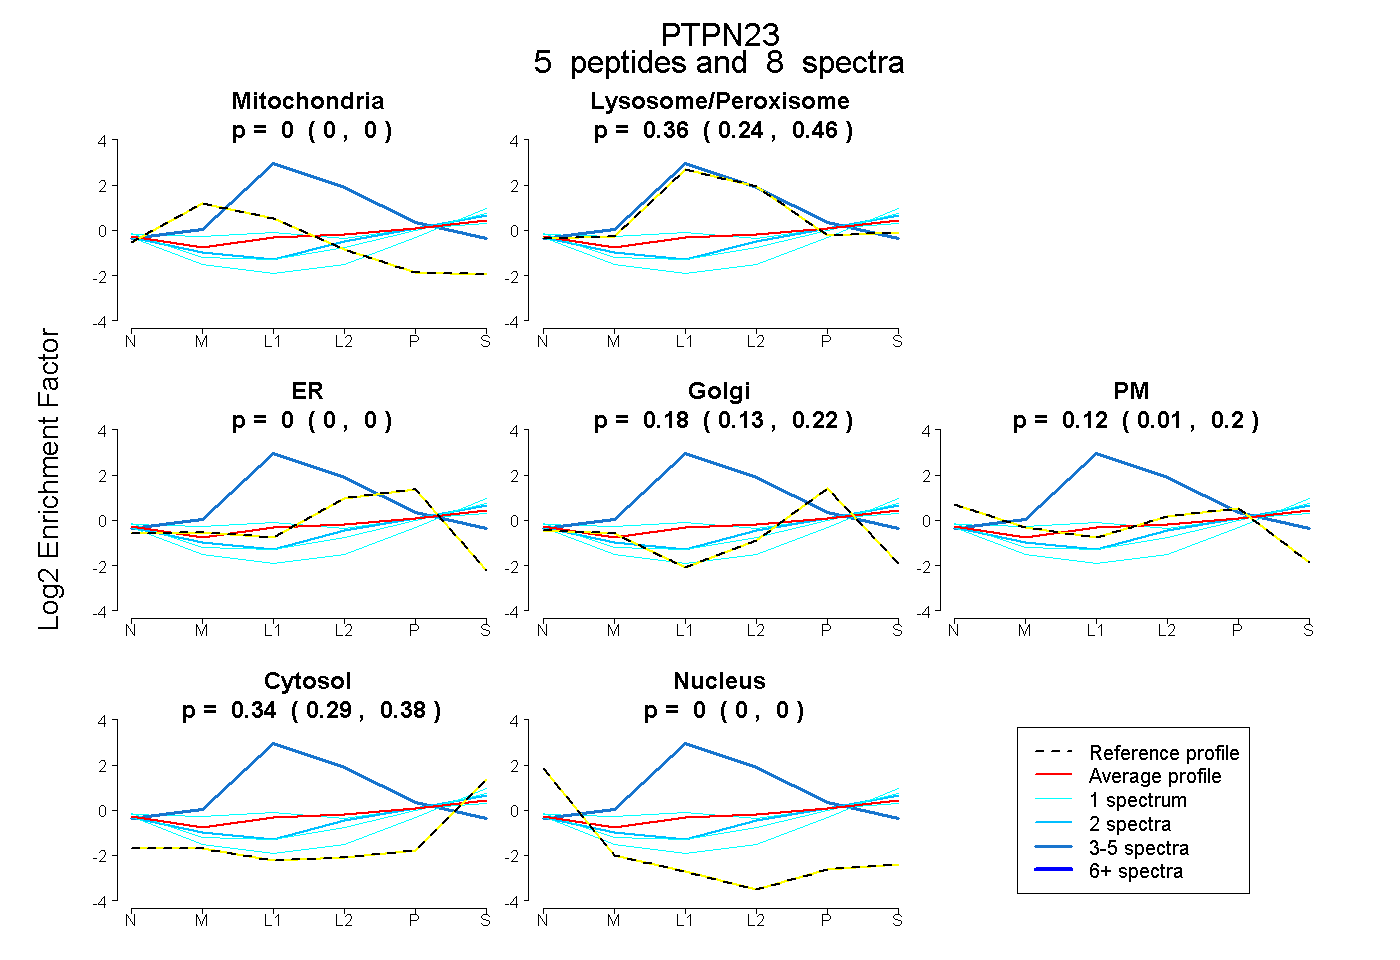
0.000 | 0.000
0.244 | 0.457
0.000 | 0.000
0.130 | 0.216
0.008 | 0.200
0.295 | 0.384
0.000 | 0.000
12peptides
spectra
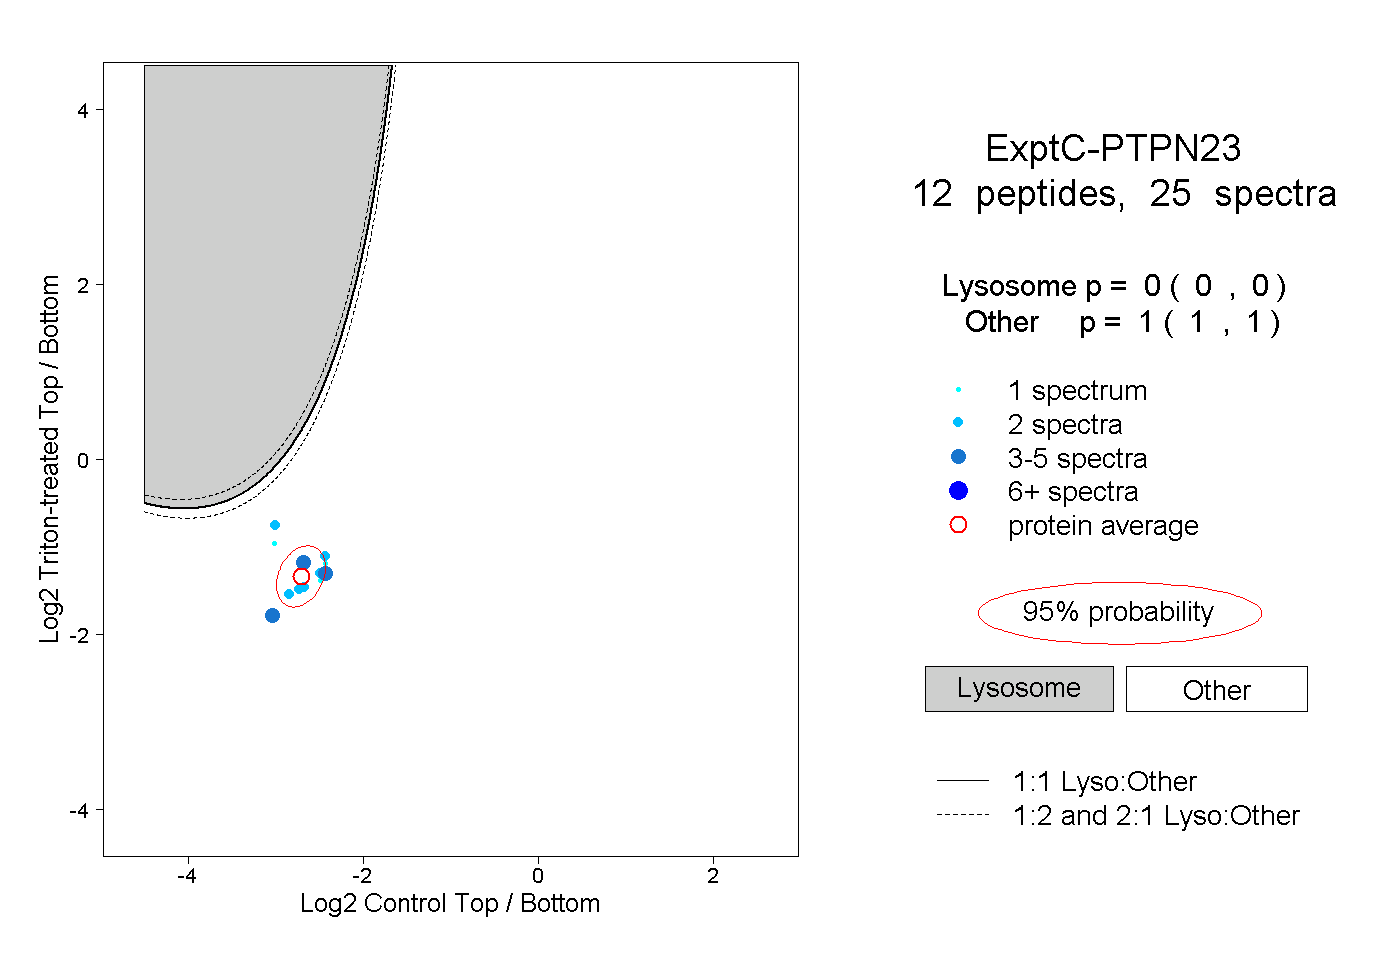
0.000 | 0.000
1.000 | 1.000
2peptides
spectra
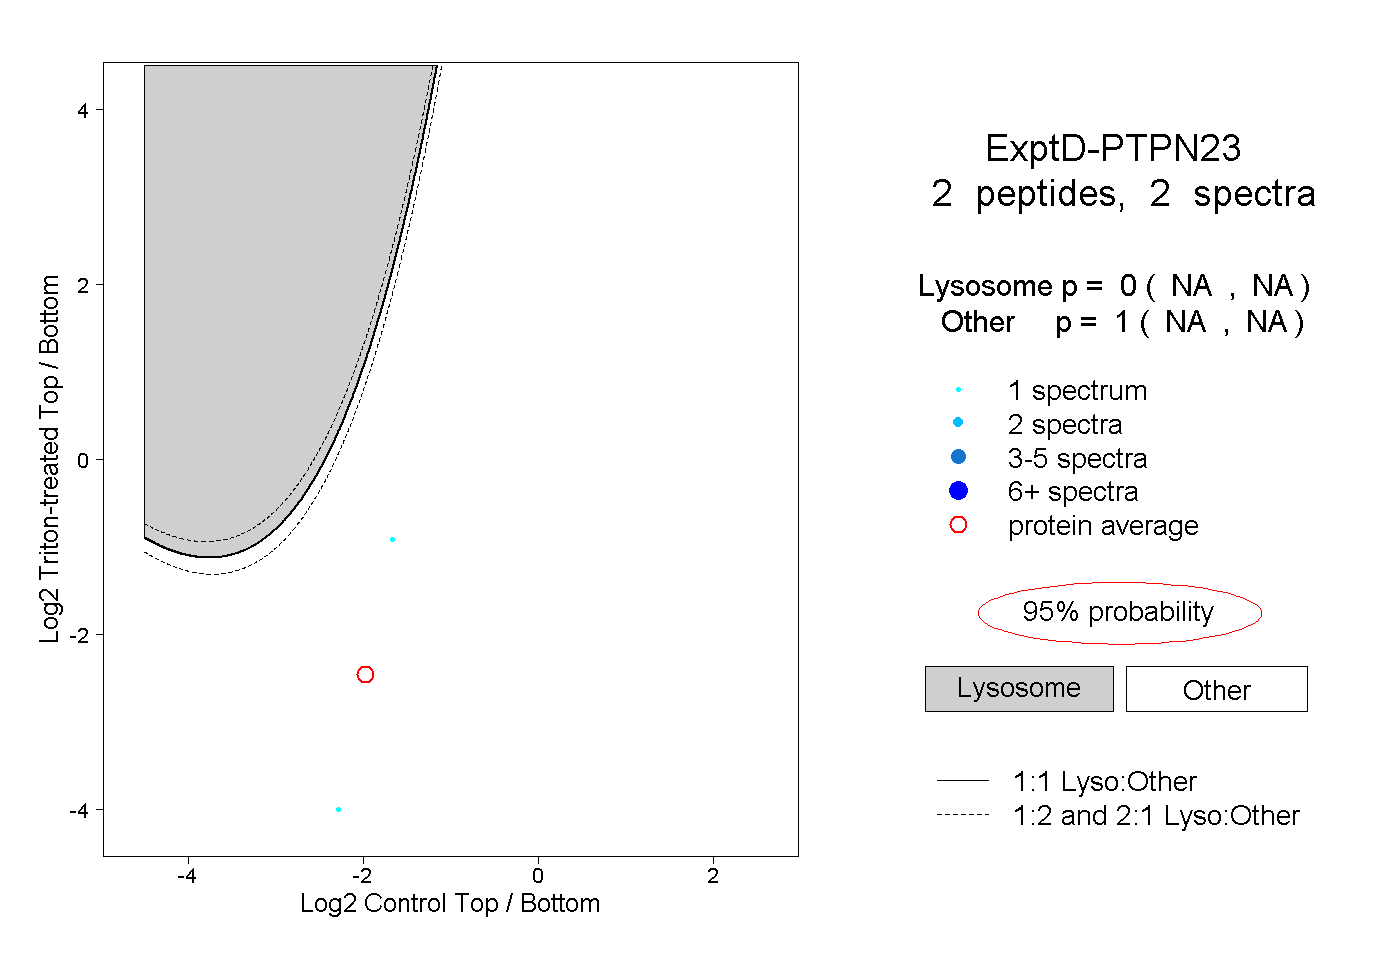
NA | NA
NA | NA