PTPN23
[ENSRNOP00000052992]
Main page
| | | Plot |
Mito |
Lyso |
|
Perox |
ER |
Golgi |
PM |
Cytosol |
Nucleus |
|
| Expt A |
 15
15
peptides |
22
spectra |
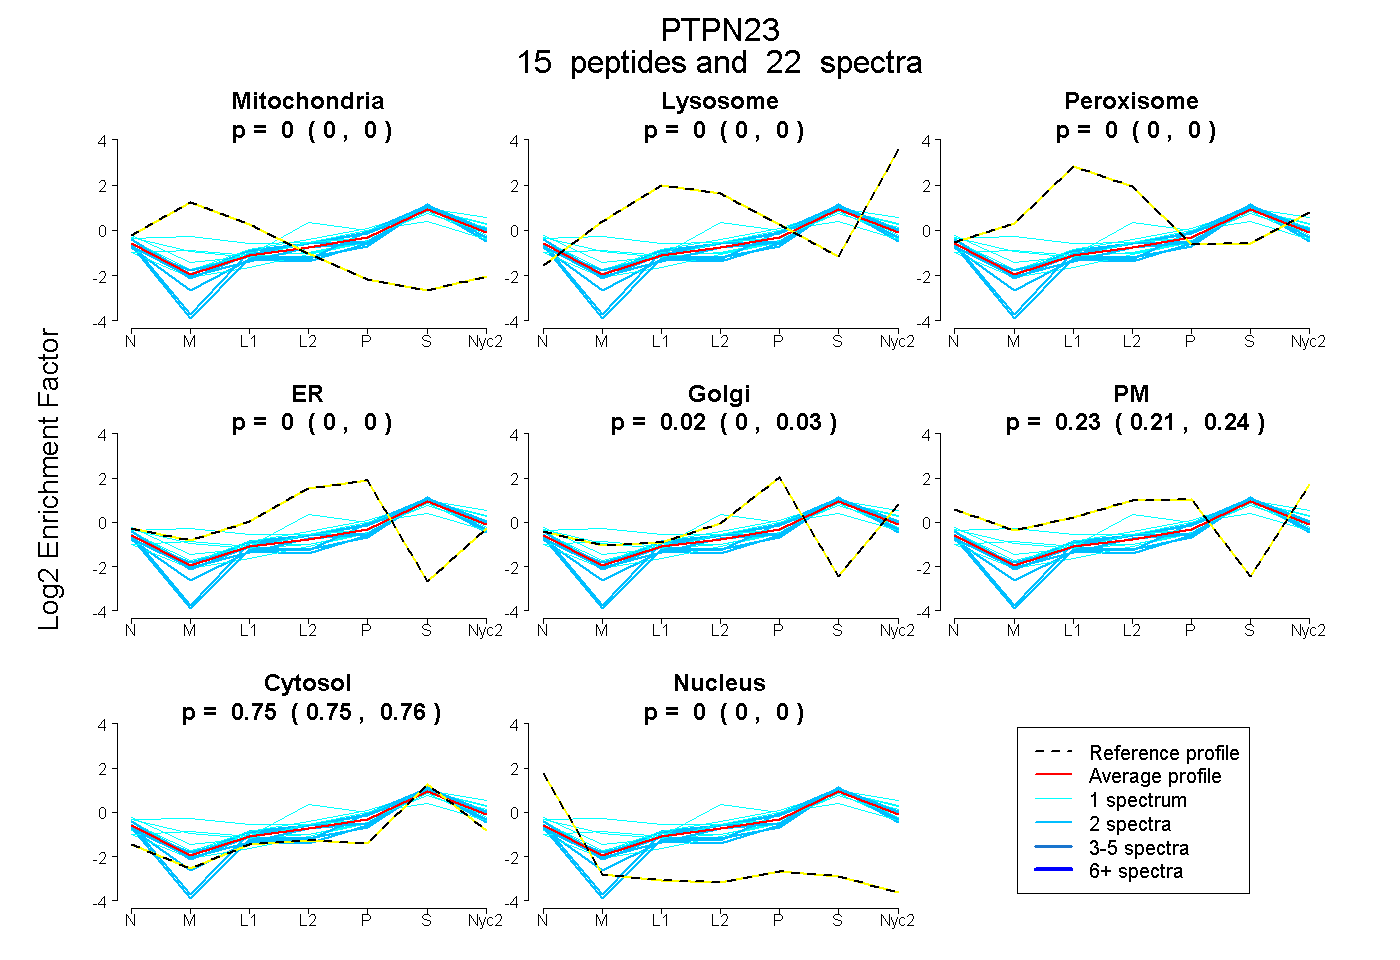 |
0.000
0.000 | 0.000 |
0.000
0.000 | 0.000 |
|
0.000
0.000 | 0.000 |
0.000
0.000 | 0.000 |
0.018
0.005 | 0.031 |
0.228
0.211 | 0.241 |
0.754
0.748 | 0.759 |
0.000
0.000 | 0.000 |
|
| | | Plot |
Mito |
|
Lyso or Perox |
|
ER |
Golgi |
PM |
Cytosol |
Nucleus |
|
| Expt B |
5
peptides |
8
spectra |
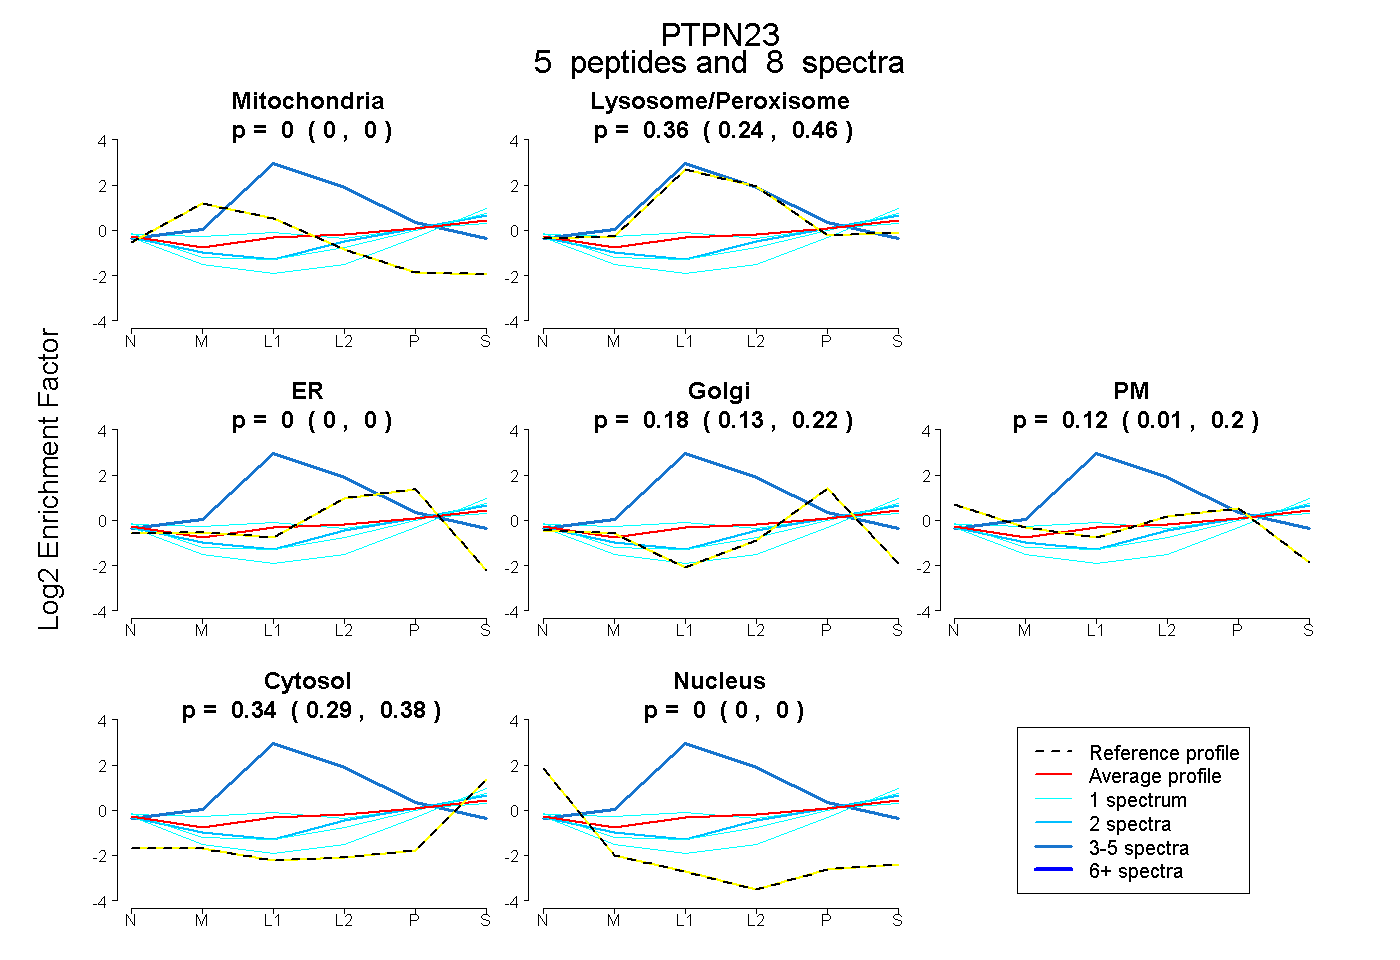 |
0.000
0.000 | 0.000 |
|
0.357
0.244 | 0.457 |
|
0.000
0.000 | 0.000 |
0.178
0.130 | 0.216 |
0.122
0.008 | 0.200 |
0.343
0.295 | 0.384 |
0.000
0.000 | 0.000 |
|
| 1 spectrum, VAALLER |
0.000 |
|
0.000 |
|
0.000 |
0.083 |
0.257 |
0.659 |
0.000 |
|
| 3 spectra, LLSGPLDQVR |
0.000 |
|
0.971 |
|
0.029 |
0.000 |
0.000 |
0.000 |
0.000 |
|
| 2 spectra, SFLVAR |
0.000 |
|
0.185 |
|
0.000 |
0.189 |
0.183 |
0.442 |
0.000 |
|
| 1 spectrum, GQPDTVQDALR |
0.000 |
|
0.354 |
|
0.000 |
0.127 |
0.210 |
0.309 |
0.000 |
|
| 1 spectrum, VLSLQFR |
0.000 |
|
0.129 |
|
0.000 |
0.085 |
0.288 |
0.498 |
0.000 |
|
| | | Plot |
|
Lyso |
|
|
|
|
|
|
|
Other |
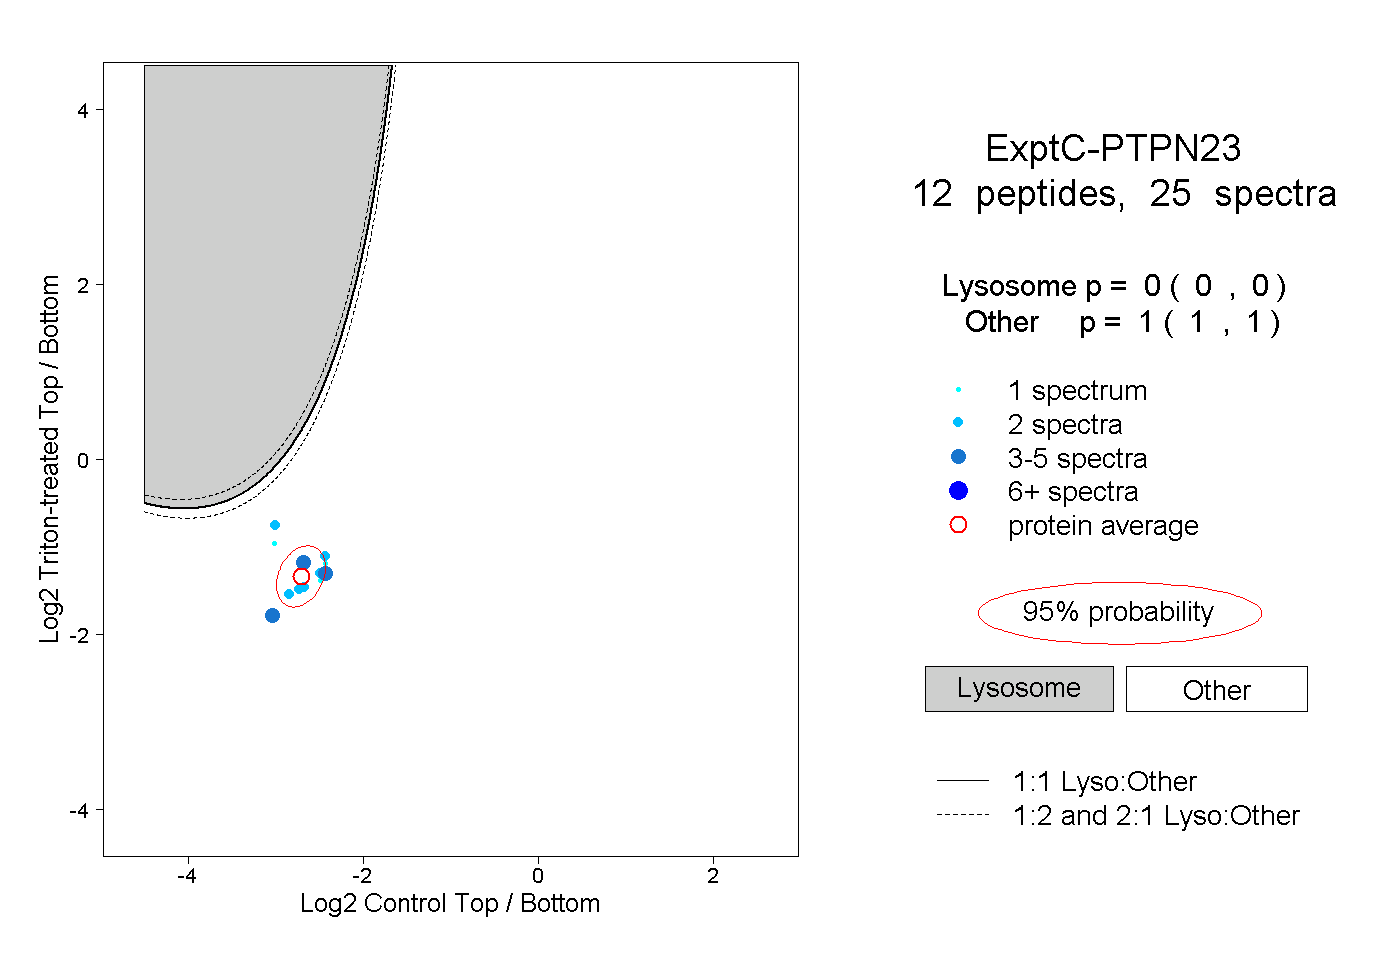
| Expt C |
12
peptides |
25
spectra |
 |
|
0.000
0.000 | 0.000 |
|
|
|
|
|
|
|
1.000
1.000 | 1.000 |
| | | Plot |
|
Lyso |
|
|
|
|
|
|
|
Other |
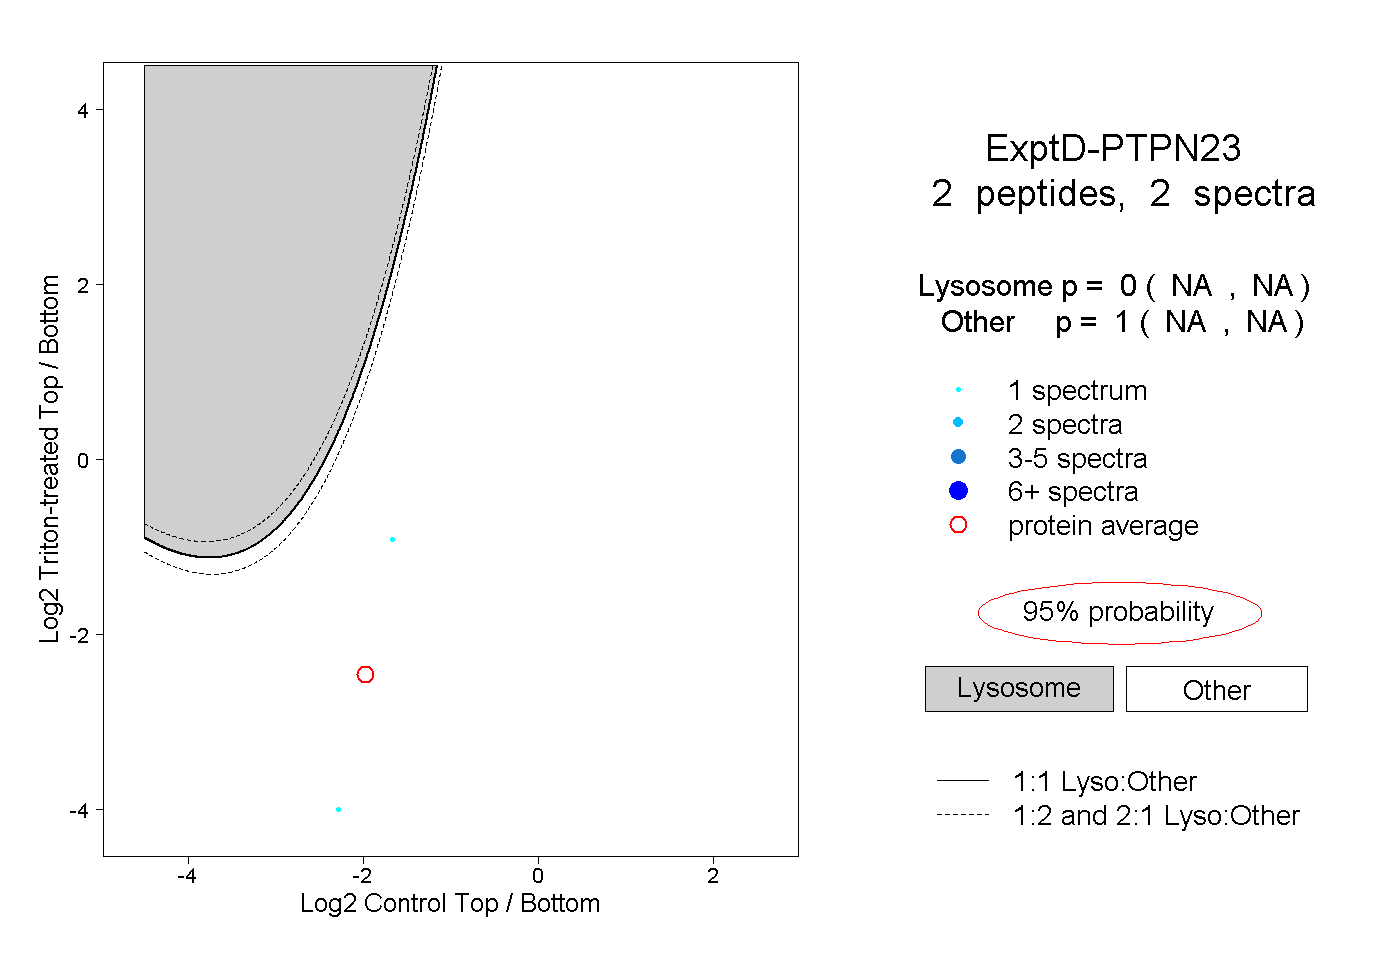
| Expt D |
2
peptides |
2
spectra |
 |
|
0.000
NA | NA |
|
|
|
|
|
|
|
1.000
NA | NA |