 3
3peptides
spectra
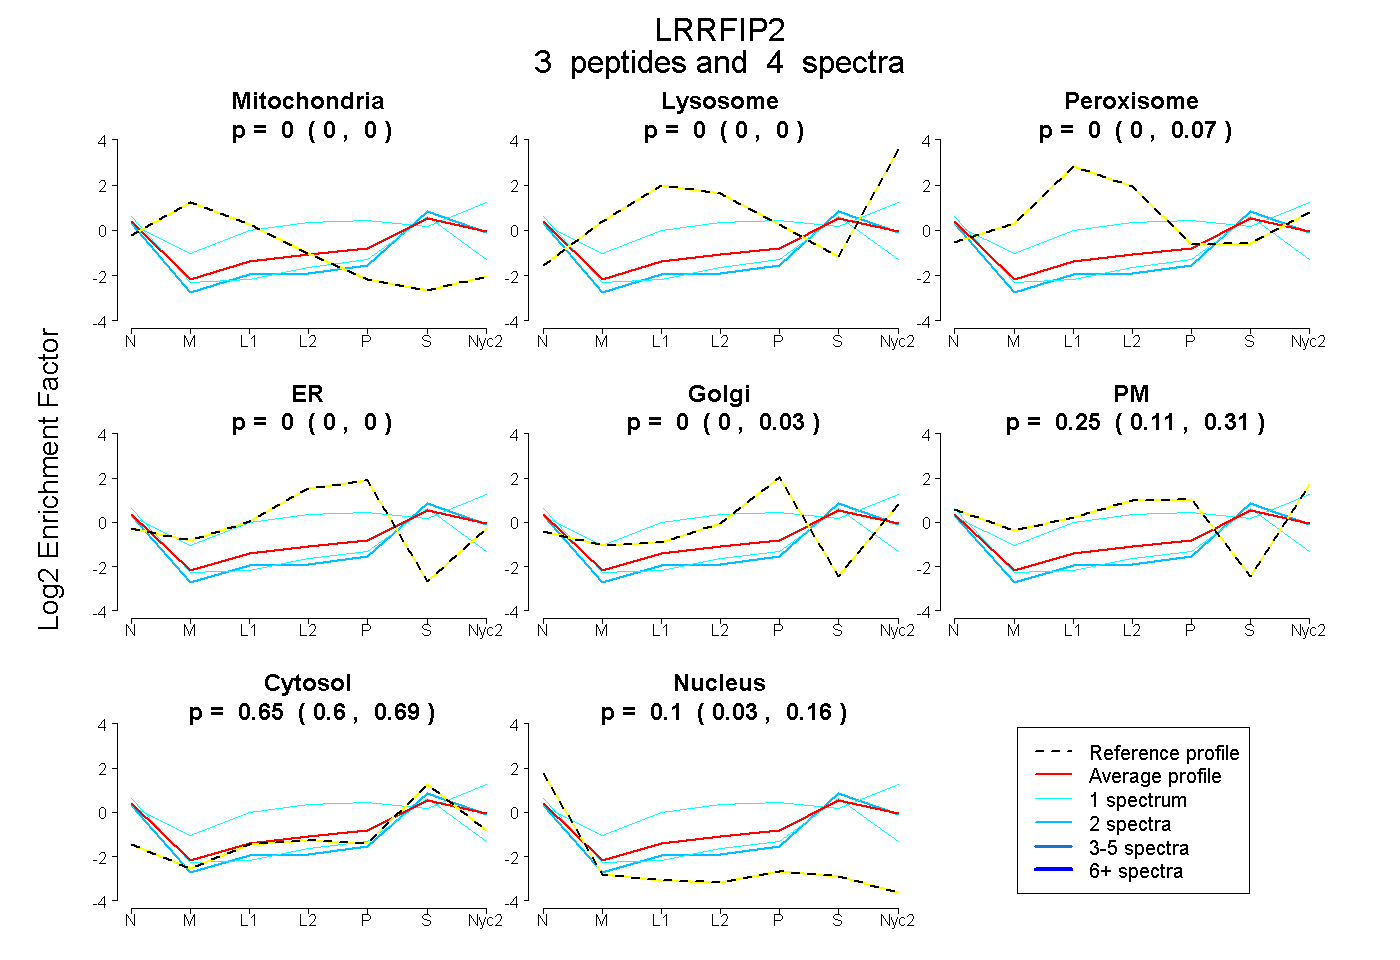
0.000 | 0.000
0.000 | 0.000
0.000 | 0.066
0.000 | 0.000
0.000 | 0.027
0.110 | 0.311
0.596 | 0.687
0.025 | 0.162
4peptides
spectra
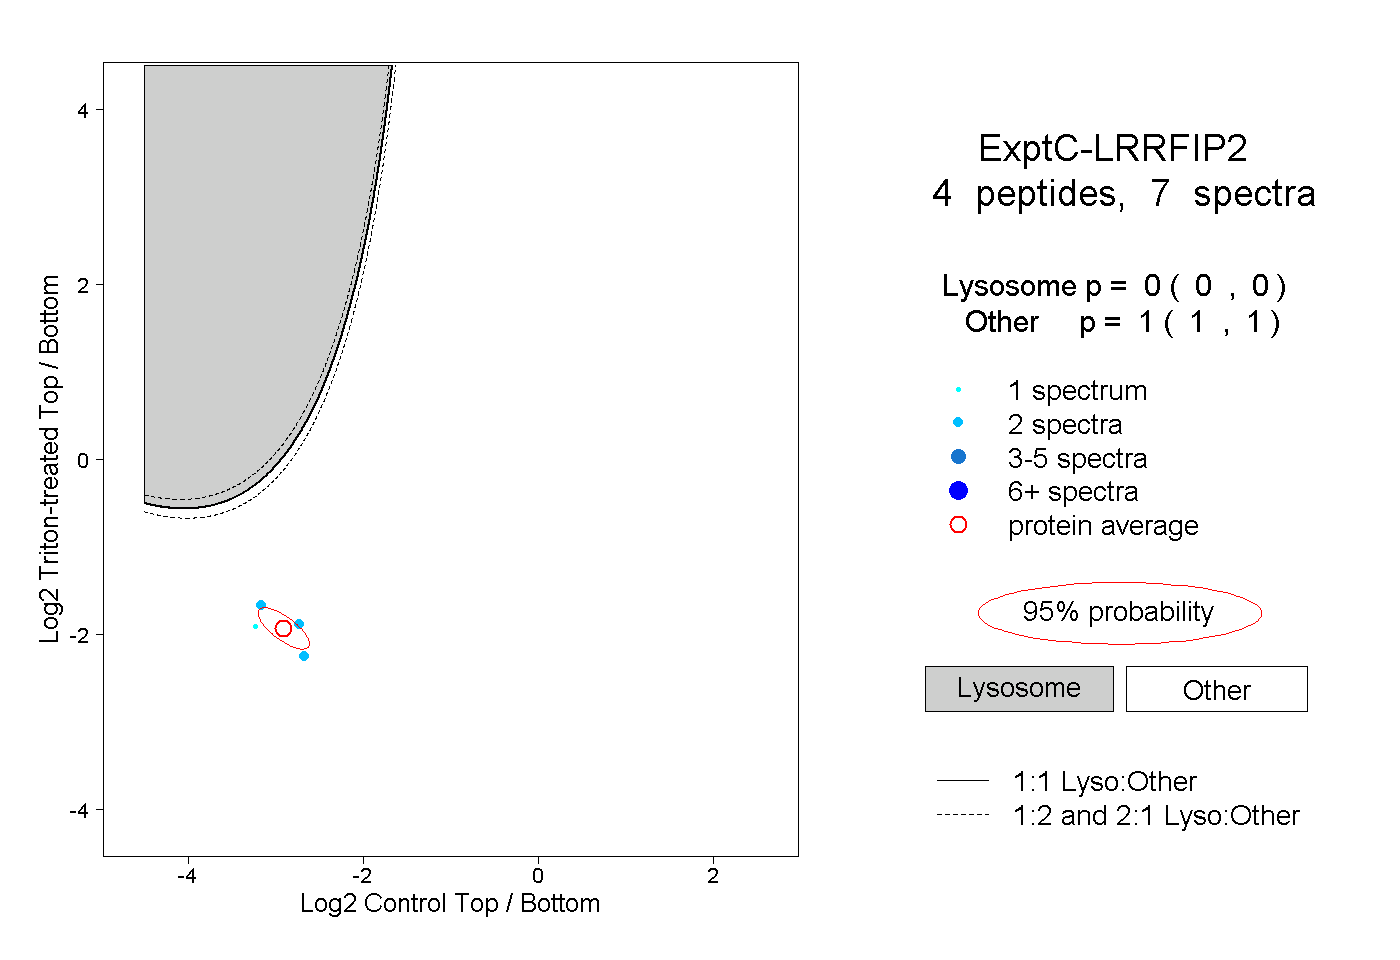
0.000 | 0.000
1.000 | 1.000
1peptide
spectrum
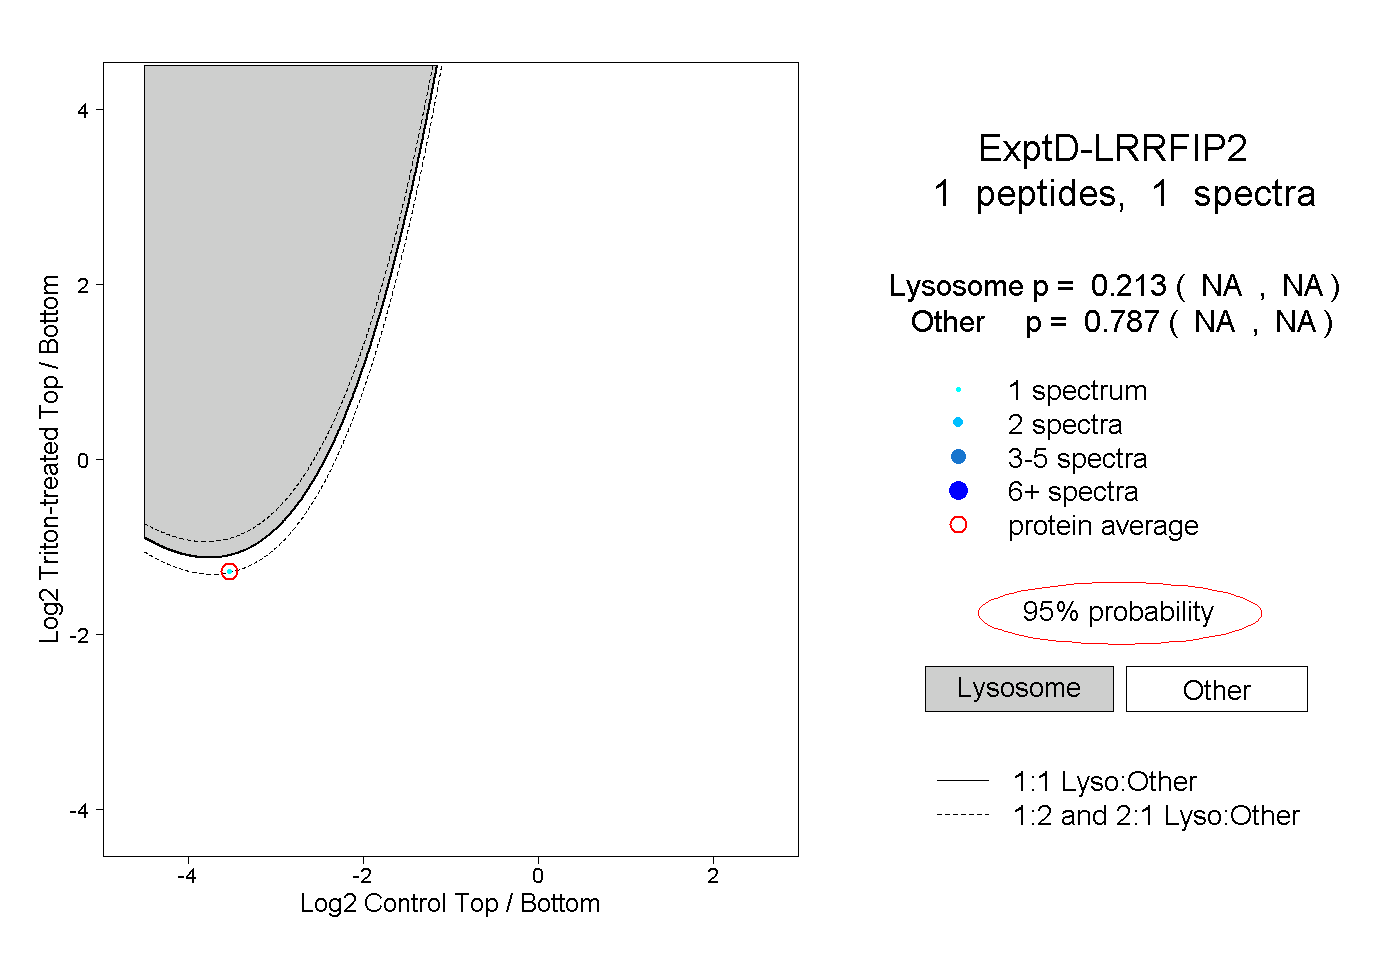
NA | NA
NA | NA