 3
3peptides
spectra
0.000 | 0.000
0.000 | 0.000
0.000 | 0.066
0.000 | 0.000
0.000 | 0.027
0.110 | 0.311
0.596 | 0.687
0.025 | 0.162
4peptides
spectra
0.000 | 0.000
1.000 | 1.000
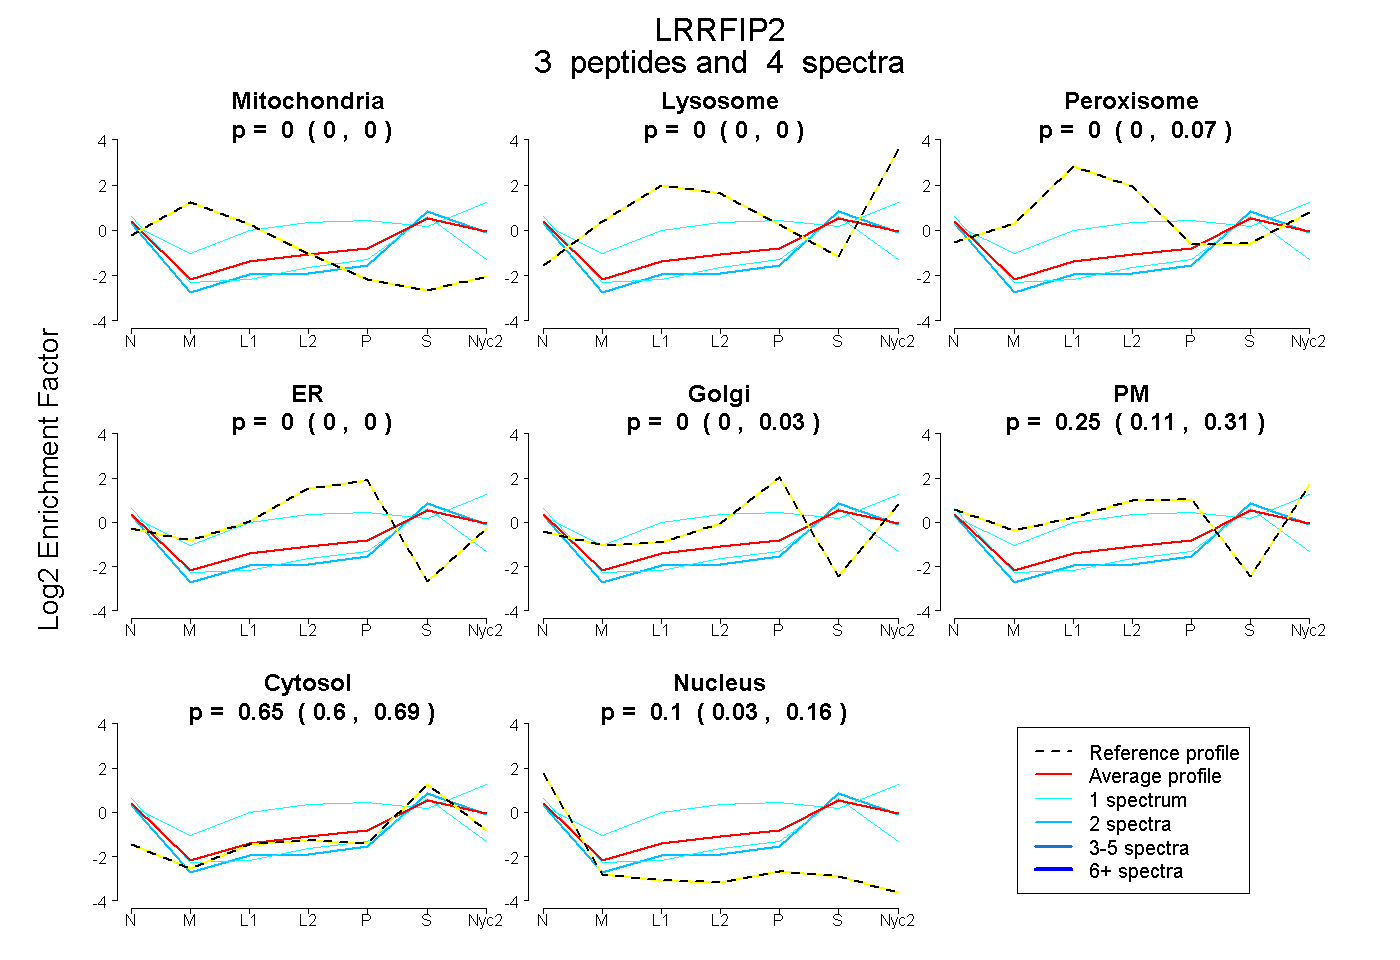
| Plot | Mito | Lyso | Perox | ER | Golgi | PM | Cytosol | Nucleus | |||||
| Expt A |
3 peptides |
4 spectra |
|
0.000 0.000 | 0.000 |
0.000 0.000 | 0.000 |
0.000 0.000 | 0.066 |
0.000 0.000 | 0.000 |
0.000 0.000 | 0.027 |
0.247 0.110 | 0.311 |
0.654 0.596 | 0.687 |
0.099 0.025 | 0.162 |
||
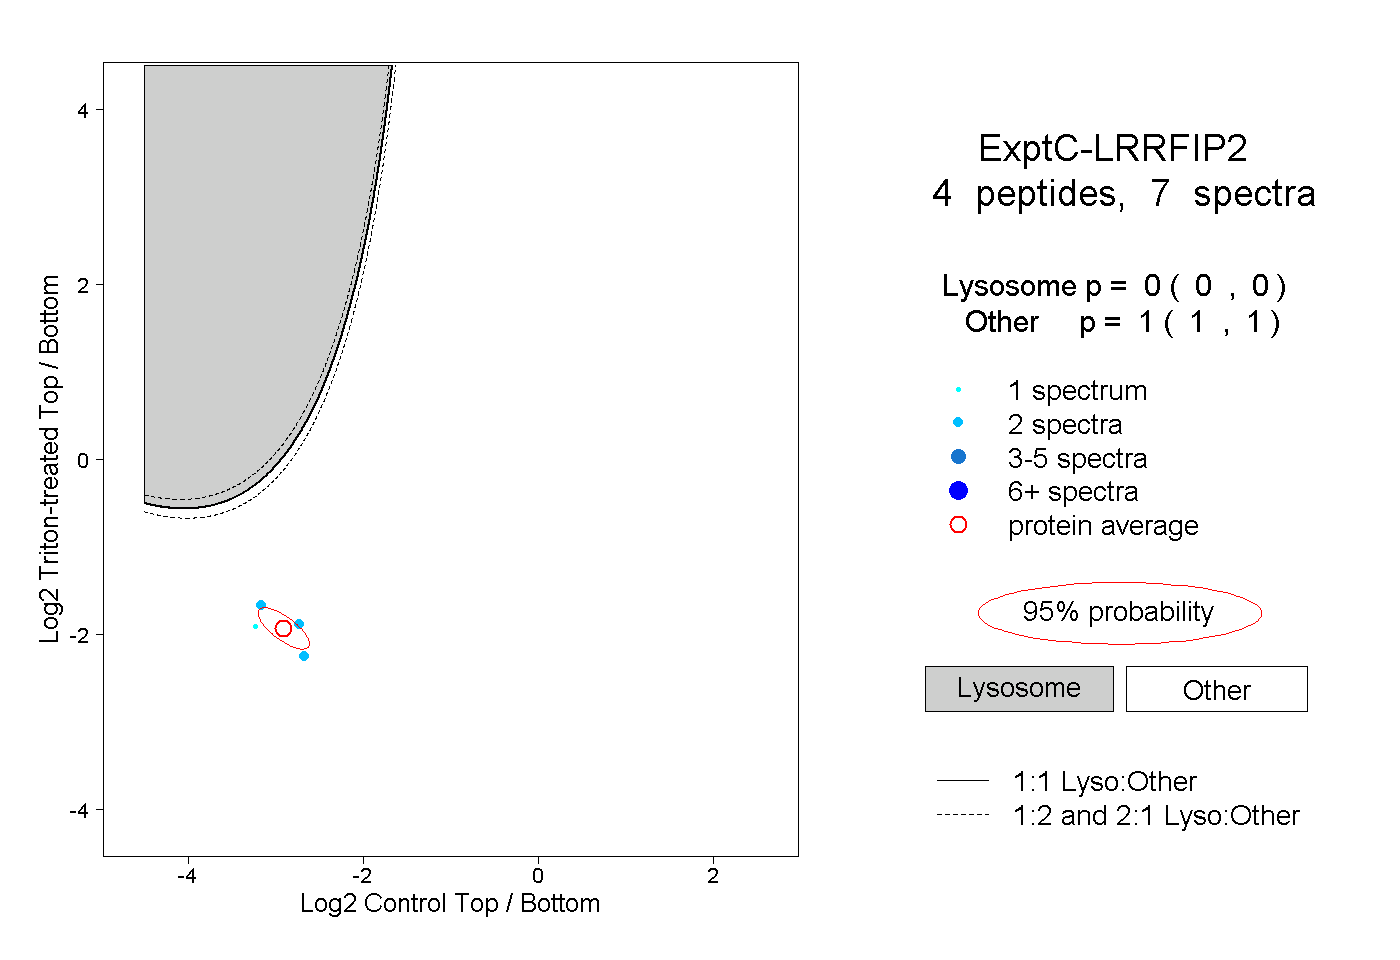
| Plot | Lyso | Other | |||||||||||
| Expt C |
4 peptides |
7 spectra |
|
0.000 0.000 | 0.000 |
1.000 1.000 | 1.000 |
| 2 spectra, ESLSEVEEK | 0.000 | 1.000 | ||||||||
| 2 spectra, TAAENAEK | 0.000 | 1.000 | ||||||||
| 1 spectrum, LEGQVLR | 0.000 | 1.000 | ||||||||
| 2 spectra, AMVSNAQLDNEK | 0.000 | 1.000 |
| Plot | Lyso | Other | |||||||||||
| Expt D |
1 peptide |
1 spectrum |
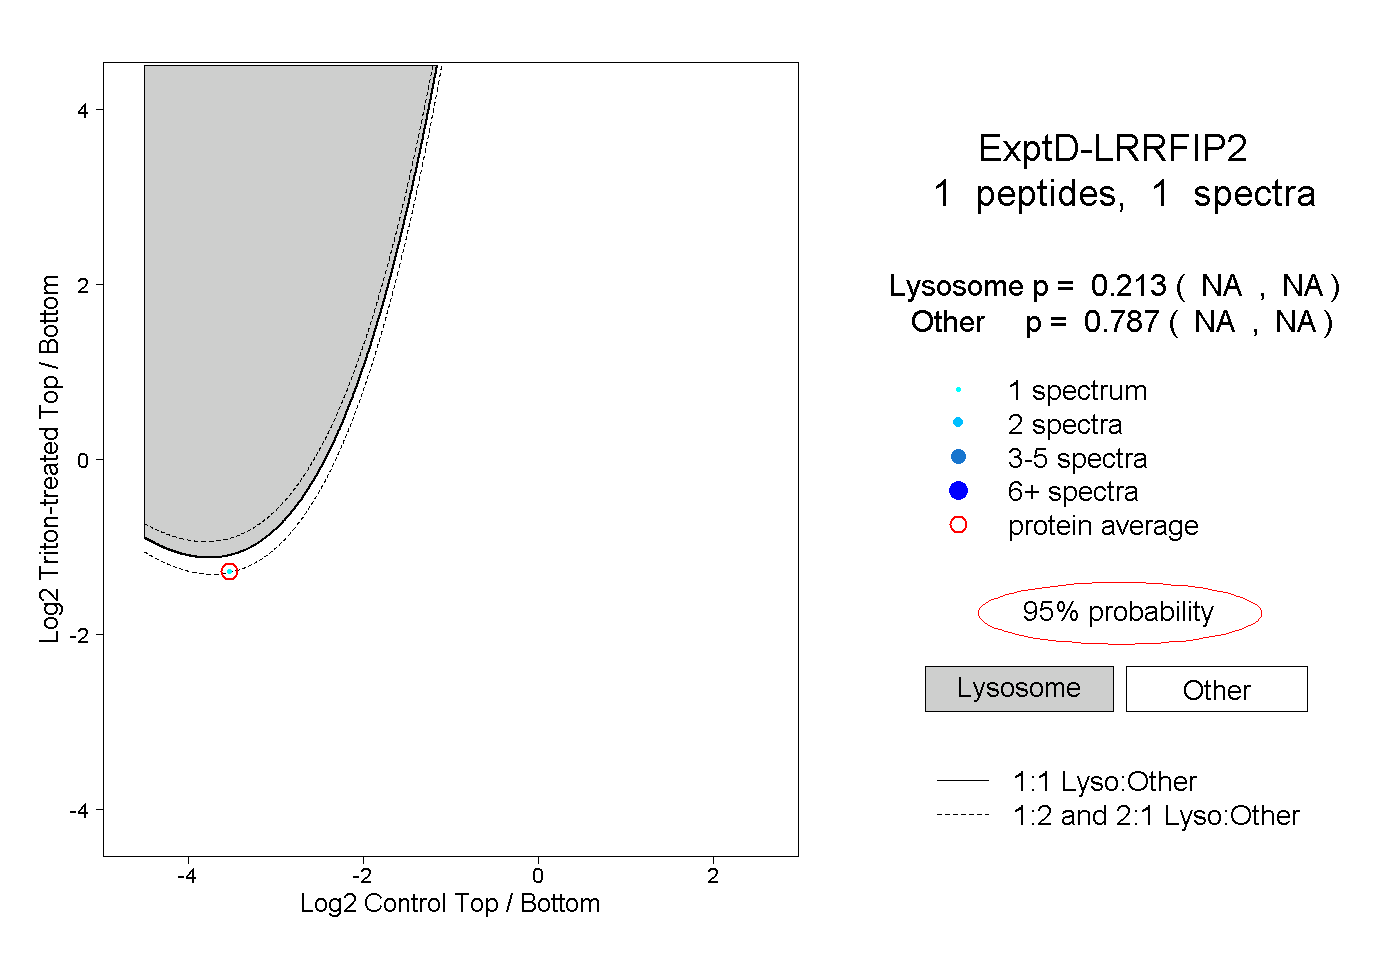 |
0.213 NA | NA |
0.787 NA | NA |