 2
2peptides
spectra
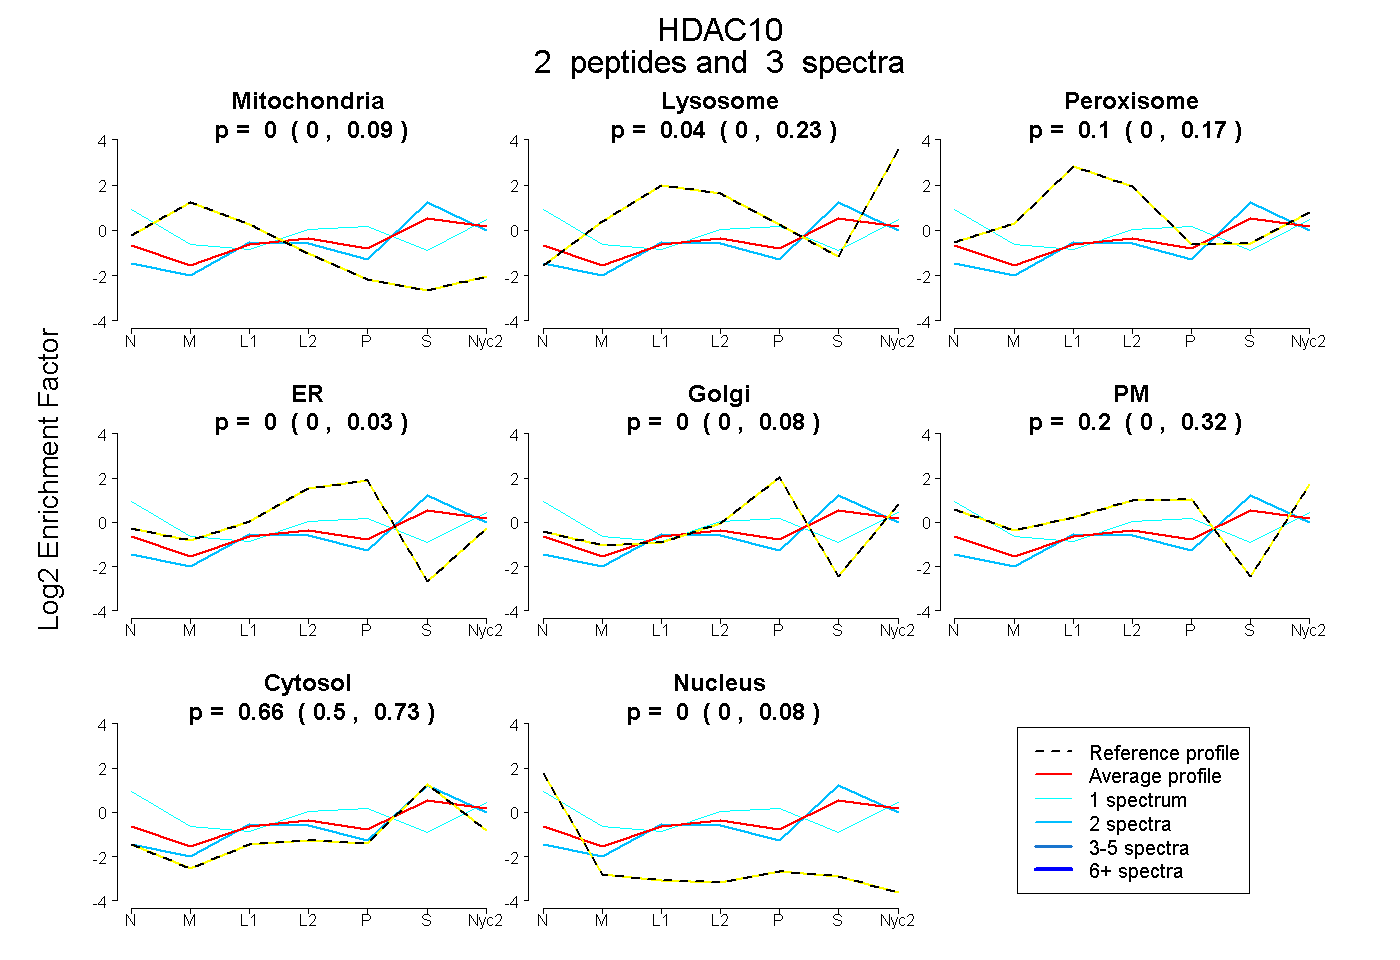
0.000 | 0.093
0.000 | 0.232
0.000 | 0.168
0.000 | 0.033
0.000 | 0.077
0.000 | 0.323
0.500 | 0.734
0.000 | 0.075
1peptide
spectrum
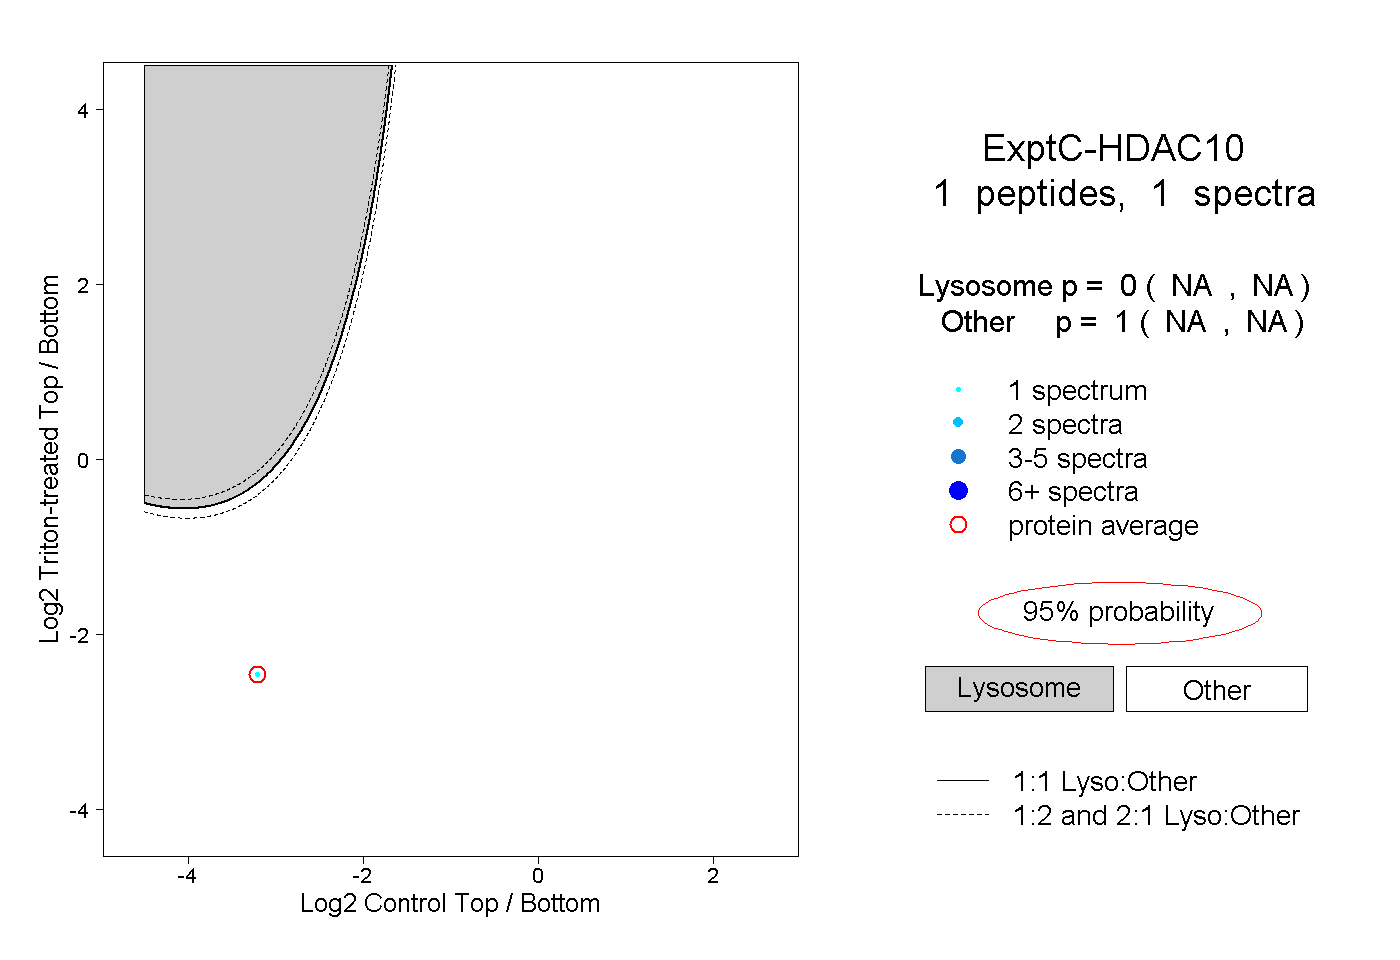
NA | NA
NA | NA
1peptide
spectrum
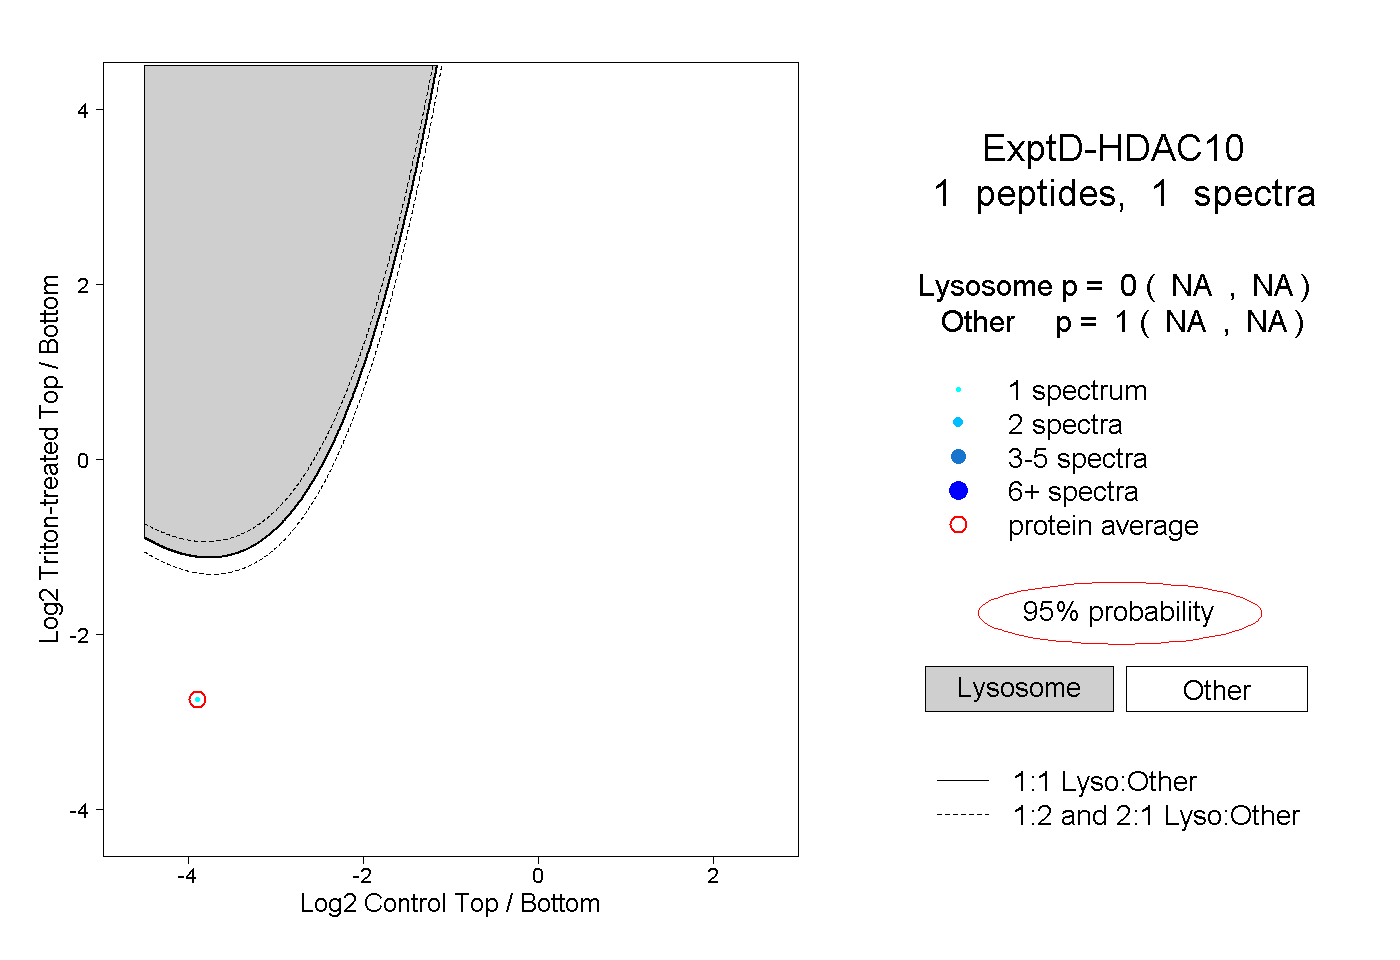
NA | NA
NA | NA