 2
2peptides
spectra
0.000 | 0.093
0.000 | 0.232
0.000 | 0.168
0.000 | 0.033
0.000 | 0.077
0.000 | 0.323
0.500 | 0.734
0.000 | 0.075
| Plot | Mito | Lyso | Perox | ER | Golgi | PM | Cytosol | Nucleus | |||||
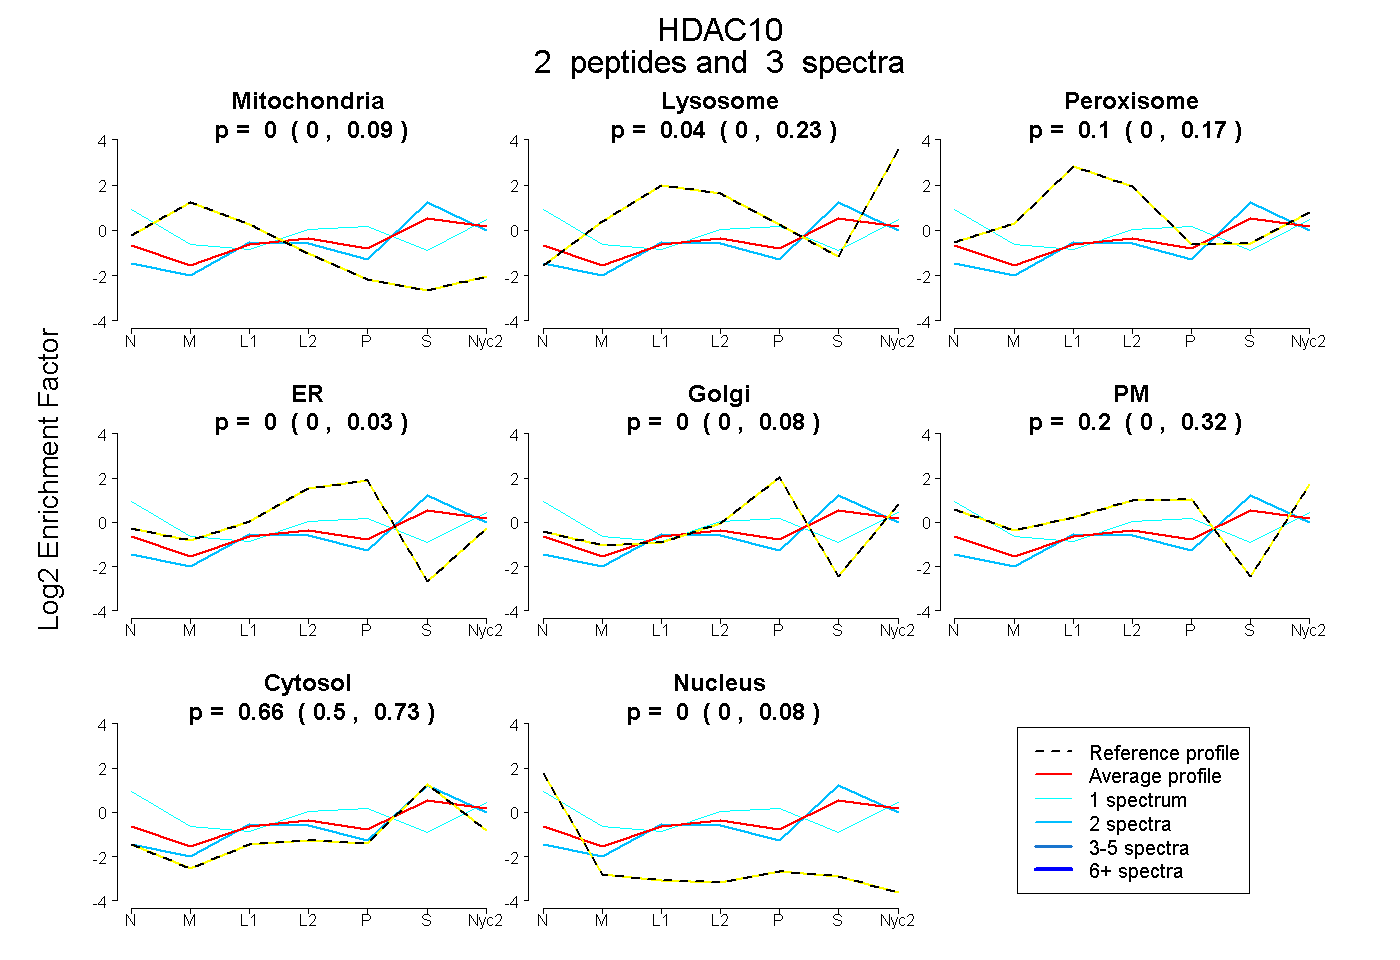
| Expt A |
2 peptides |
3 spectra |
|
0.000 0.000 | 0.093 |
0.041 0.000 | 0.232 |
0.102 0.000 | 0.168 |
0.000 0.000 | 0.033 |
0.000 0.000 | 0.077 |
0.199 0.000 | 0.323 |
0.658 0.500 | 0.734 |
0.000 0.000 | 0.075 |
| 1 spectrum, SQFQDDDLAALGK | 0.000 | 0.000 | 0.000 | 0.000 | 0.000 | 0.644 | 0.255 | 0.101 | ||
| 2 spectra, EETEAWAR | 0.000 | 0.124 | 0.083 | 0.000 | 0.000 | 0.000 | 0.793 | 0.000 |
| Plot | Lyso | Other | |||||||||||
| Expt C |
1 peptide |
1 spectrum |
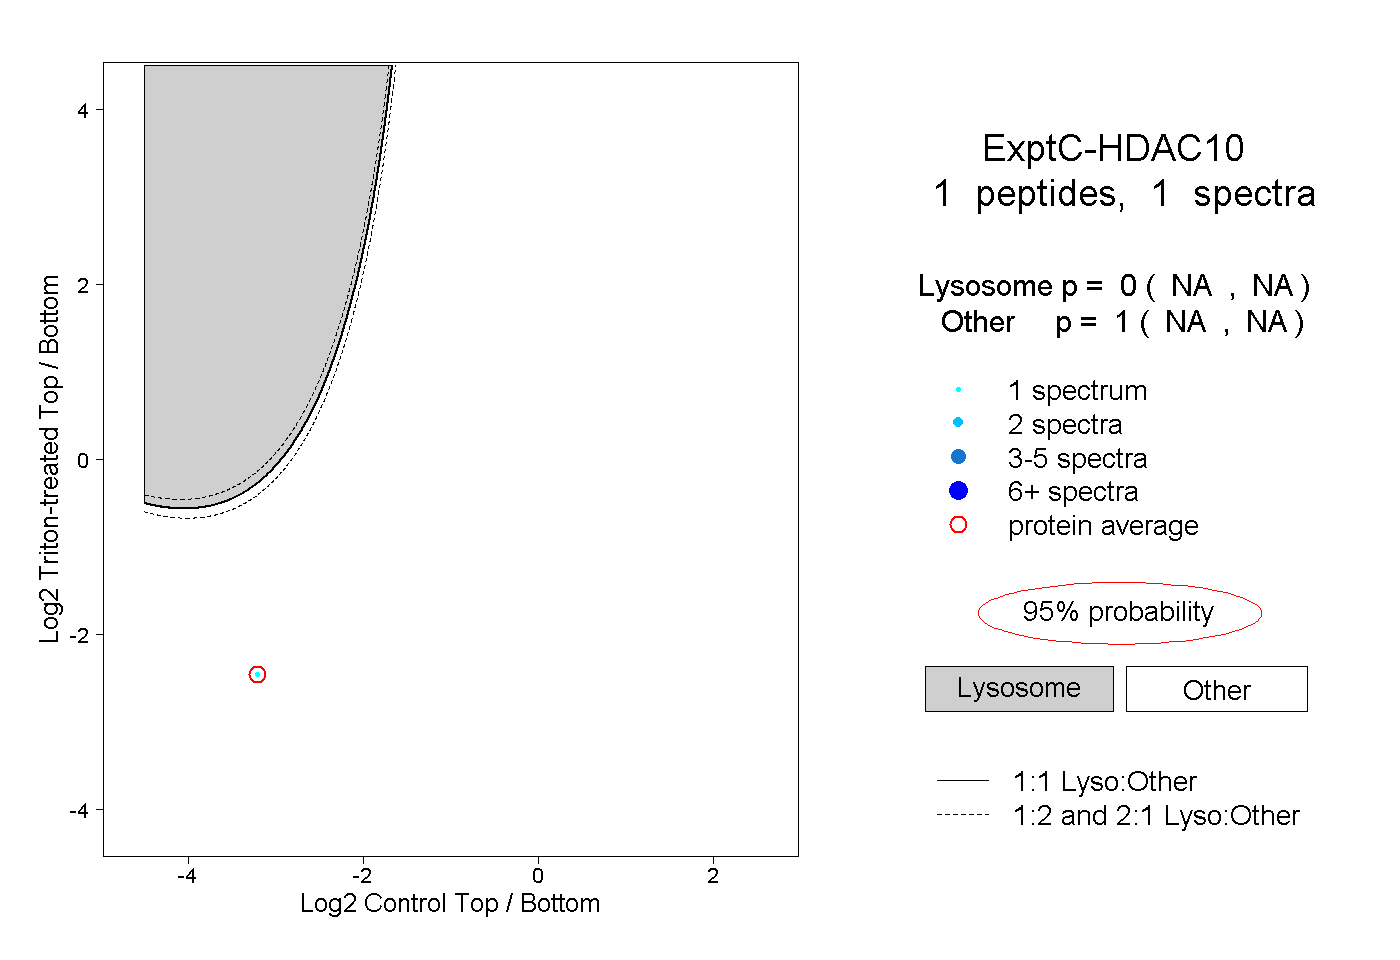 |
0.000 NA | NA |
1.000 NA | NA |
||||||||
| Plot | Lyso | Other | |||||||||||
| Expt D |
1 peptide |
1 spectrum |
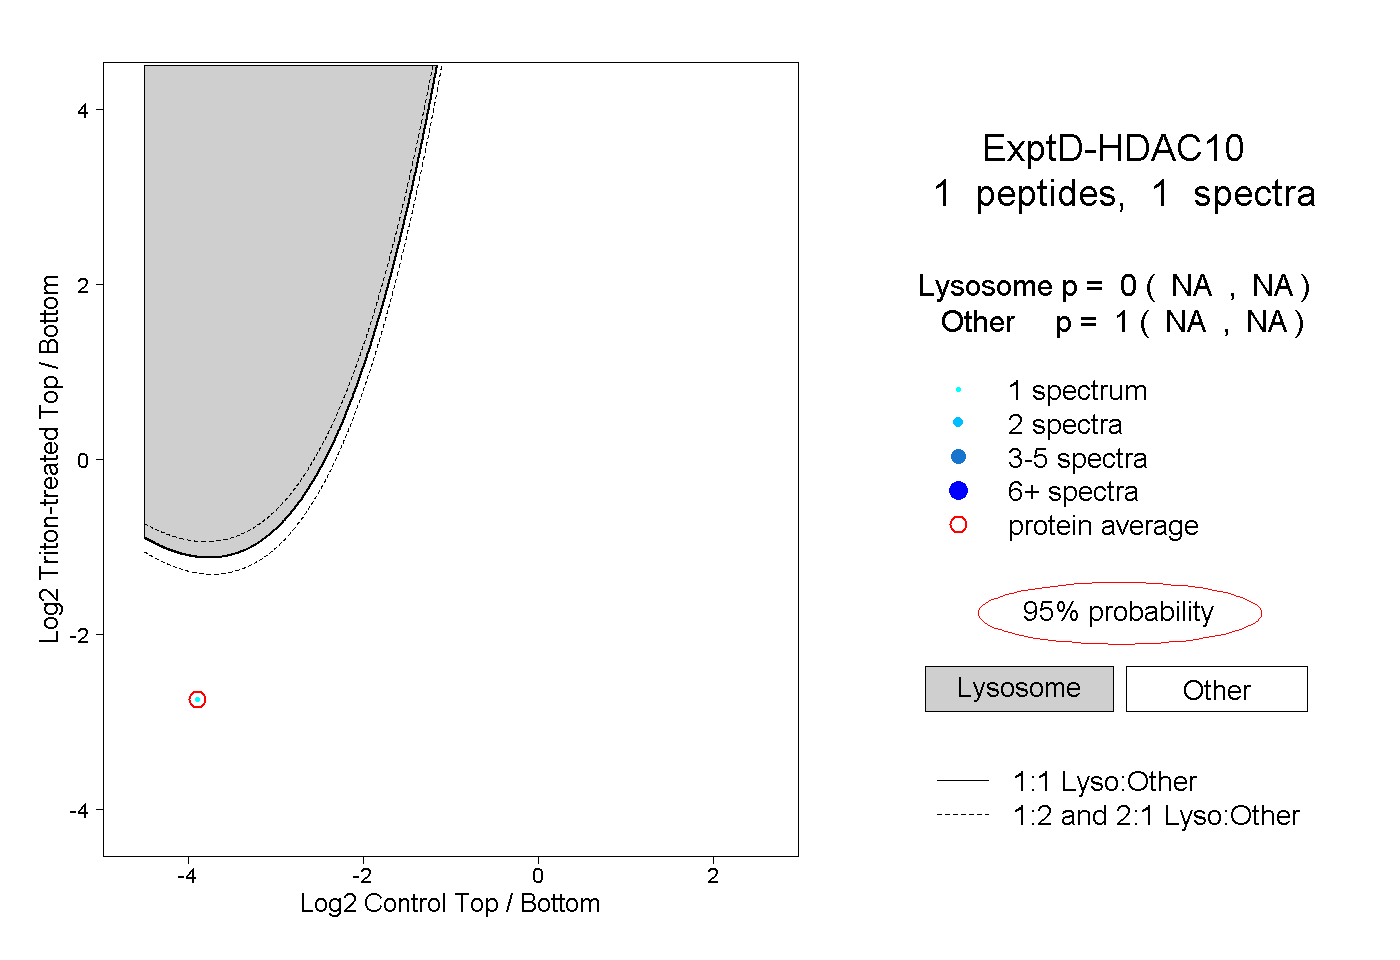 |
0.000 NA | NA |
1.000 NA | NA |