 6
6peptides
spectra
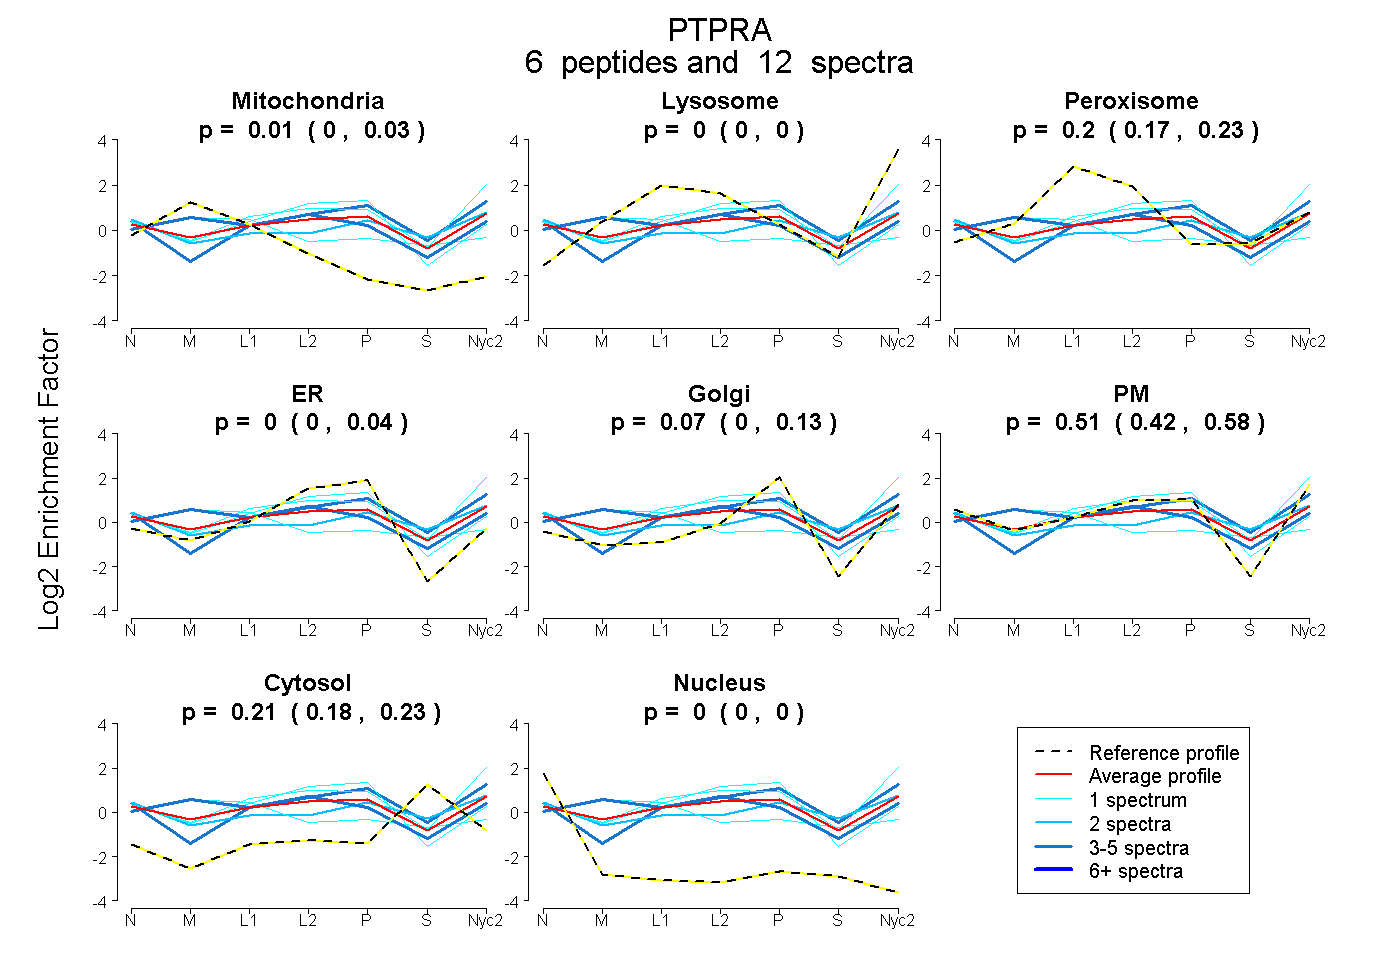
0.000 | 0.034
0.000 | 0.000
0.170 | 0.225
0.000 | 0.045
0.000 | 0.133
0.420 | 0.582
0.182 | 0.234
0.000 | 0.000
6peptides
spectra
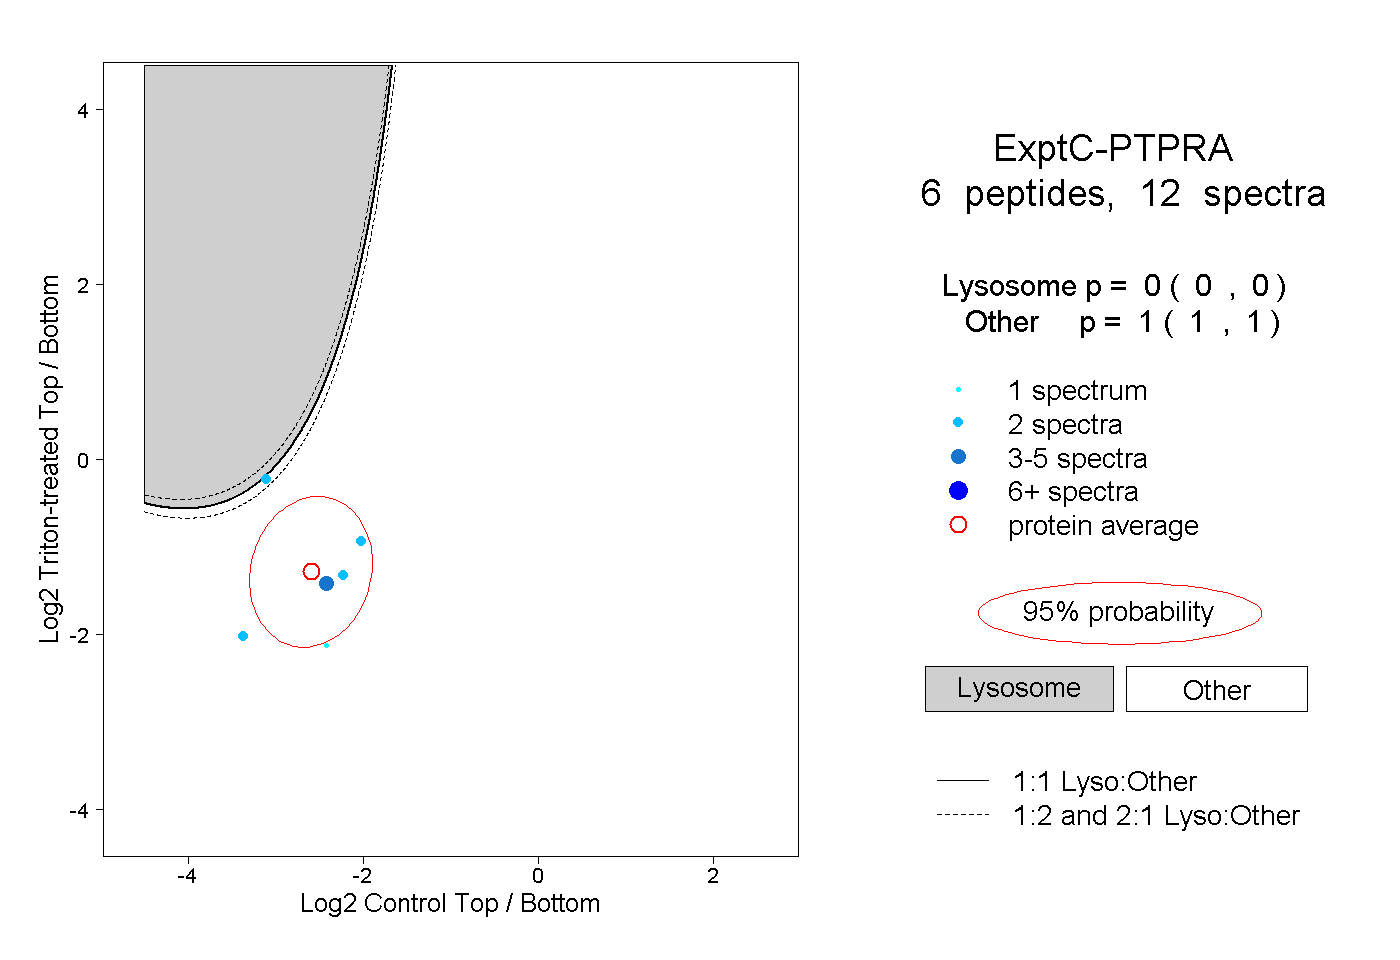
0.000 | 0.000
1.000 | 1.000
2peptides
spectra
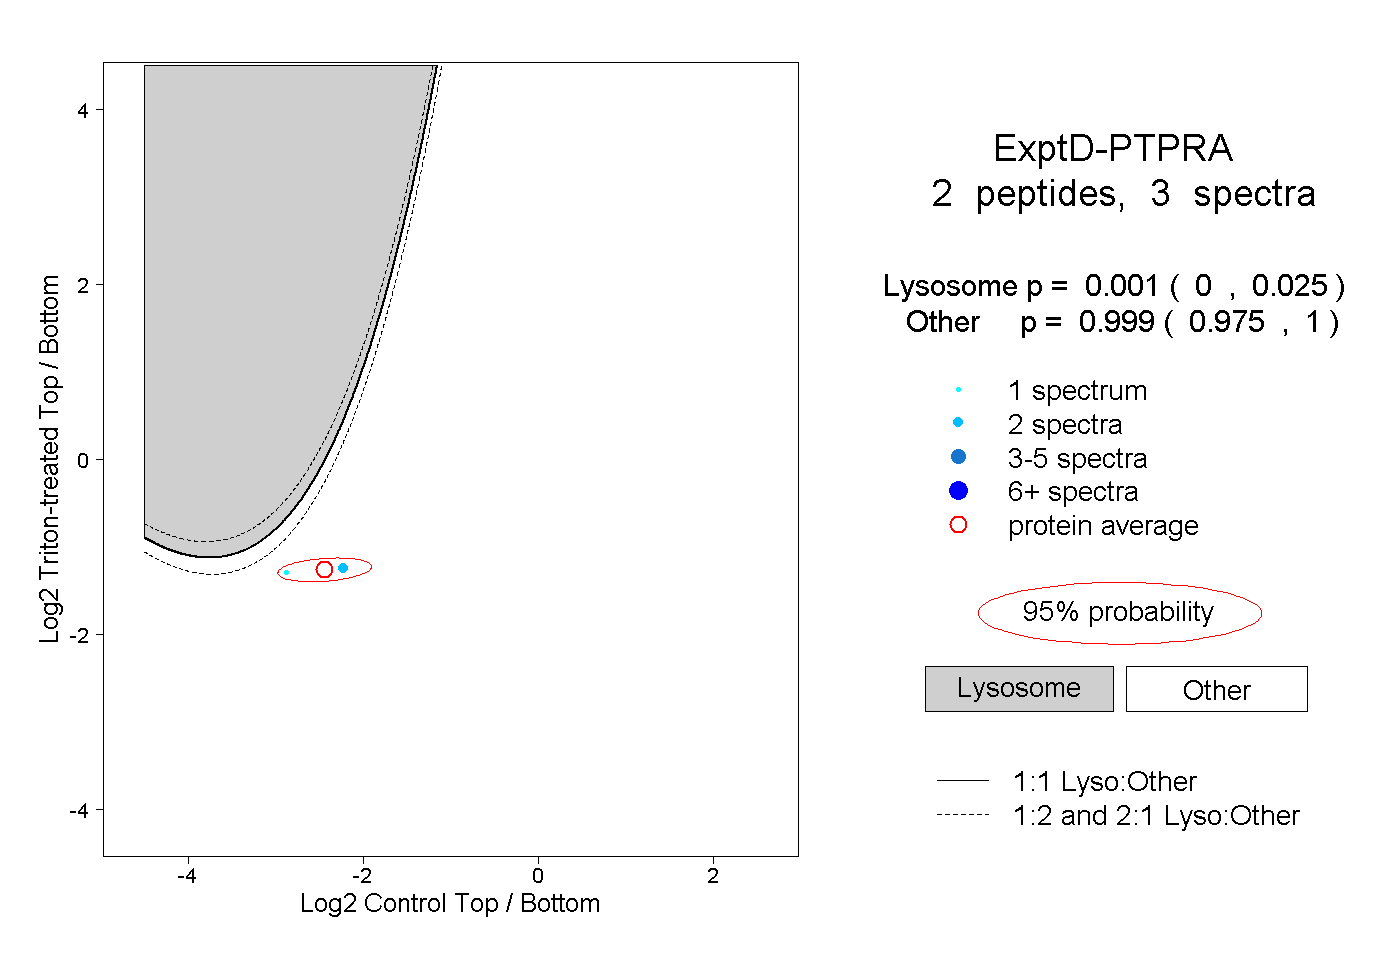
0.000 | 0.025
0.975 | 1.000