 6
6peptides
spectra
0.000 | 0.034
0.000 | 0.000
0.170 | 0.225
0.000 | 0.045
0.000 | 0.133
0.420 | 0.582
0.182 | 0.234
0.000 | 0.000
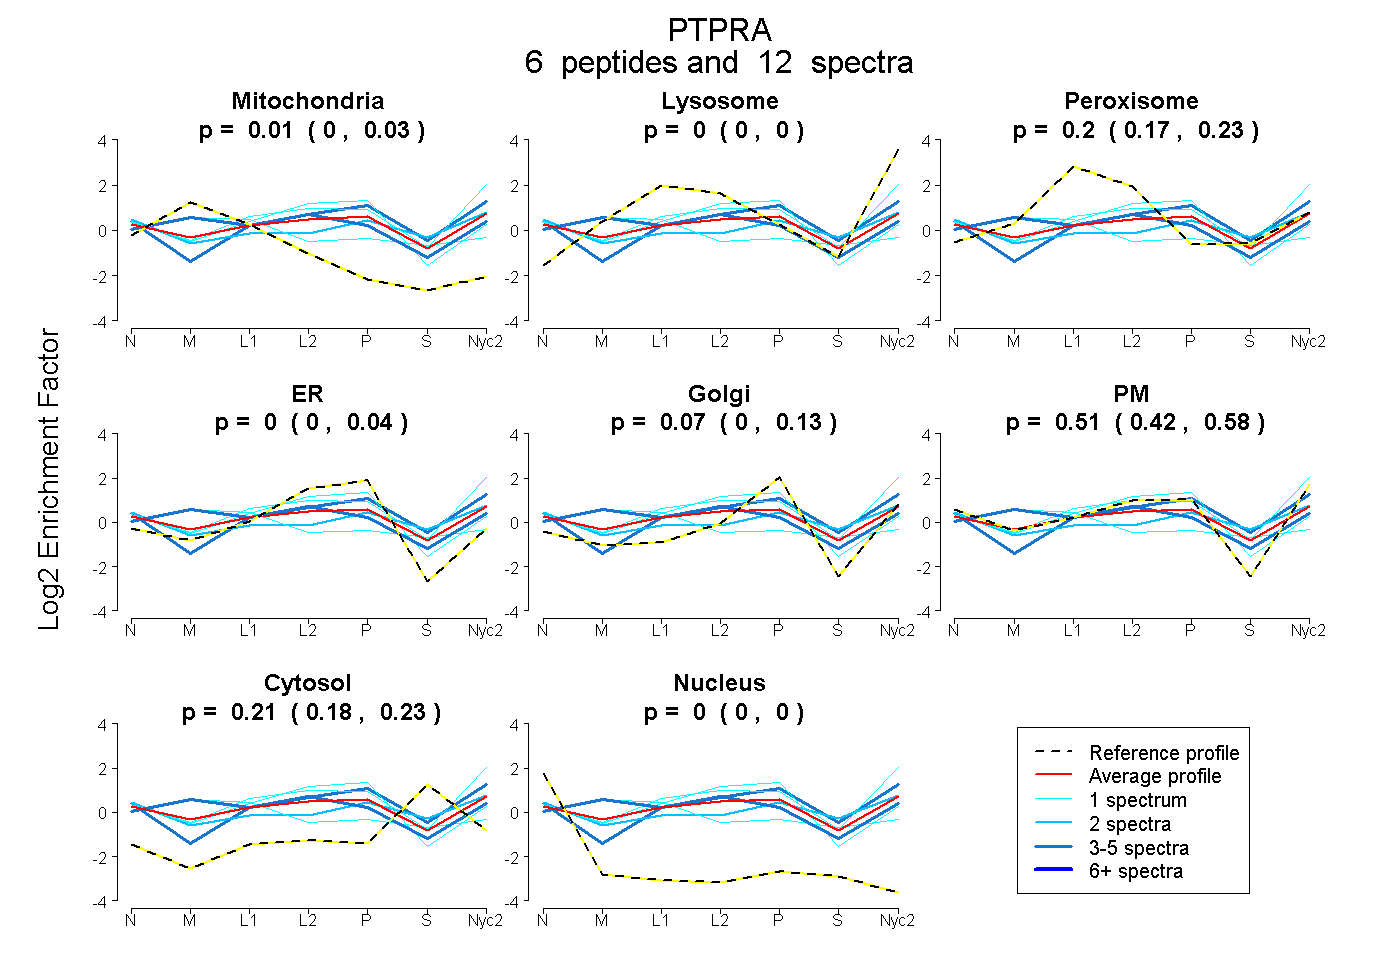
| Plot | Mito | Lyso | Perox | ER | Golgi | PM | Cytosol | Nucleus | |||||
| Expt A |
6 peptides |
12 spectra |
|
0.005 0.000 | 0.034 |
0.000 0.000 | 0.000 |
0.203 0.170 | 0.225 |
0.000 0.000 | 0.045 |
0.073 0.000 | 0.133 |
0.508 0.420 | 0.582 |
0.212 0.182 | 0.234 |
0.000 0.000 | 0.000 |
| 1 spectrum, QAGSHSNSFR | 0.000 | 0.241 | 0.059 | 0.000 | 0.000 | 0.579 | 0.121 | 0.000 | ||
| 1 spectrum, TEDVEPQSVPLLAR | 0.340 | 0.000 | 0.246 | 0.000 | 0.095 | 0.135 | 0.184 | 0.000 | ||
| 1 spectrum, SCSIVMLTELEER | 0.000 | 0.000 | 0.143 | 0.476 | 0.000 | 0.302 | 0.078 | 0.000 | ||
| 4 spectra, YVNILPYDHSR | 0.189 | 0.000 | 0.259 | 0.000 | 0.114 | 0.362 | 0.076 | 0.000 | ||
| 2 spectra, GMINIIAAVQK | 0.000 | 0.000 | 0.070 | 0.000 | 0.000 | 0.574 | 0.355 | 0.000 | ||
| 3 spectra, DLLVTNTR | 0.000 | 0.045 | 0.059 | 0.000 | 0.003 | 0.631 | 0.263 | 0.000 |
| Plot | Lyso | Other | |||||||||||
| Expt C |
6 peptides |
12 spectra |
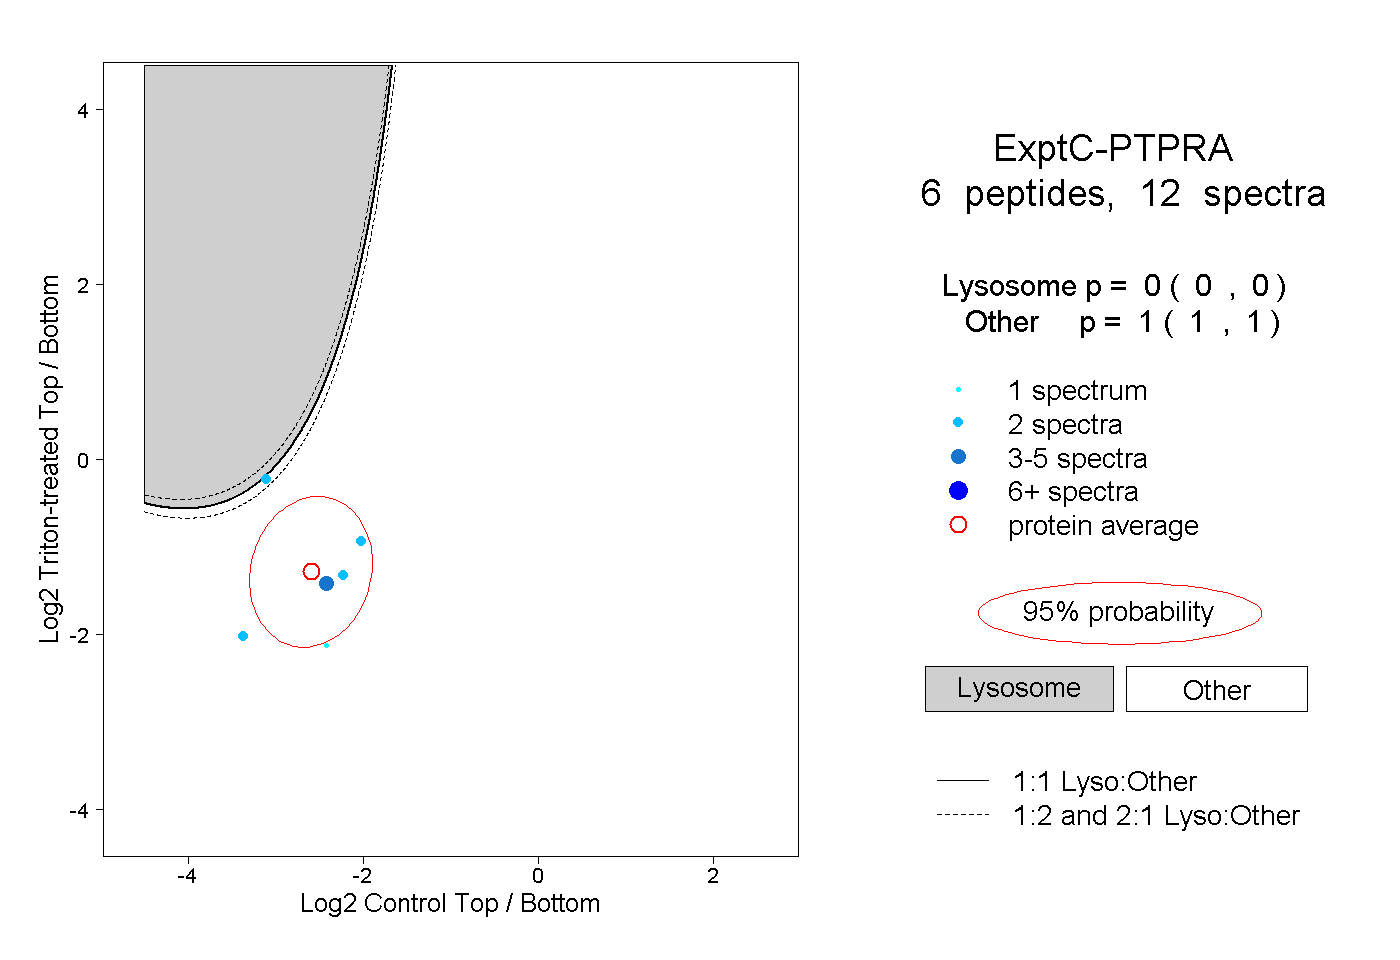 |
0.000 0.000 | 0.000 |
1.000 1.000 | 1.000 |
||||||||
| Plot | Lyso | Other | |||||||||||
| Expt D |
2 peptides |
3 spectra |
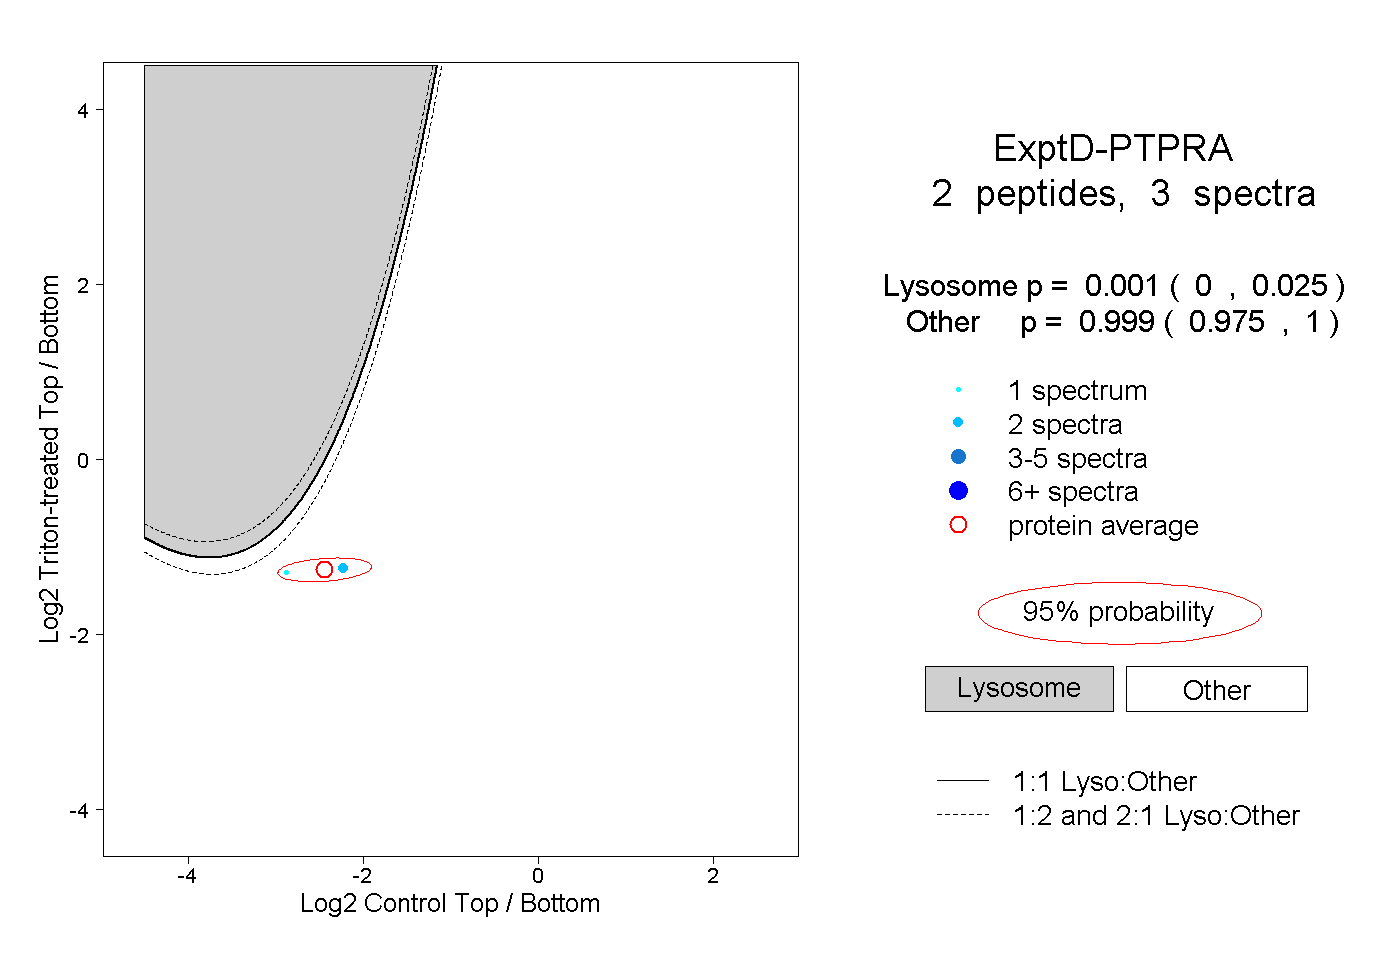 |
0.001 0.000 | 0.025 |
0.999 0.975 | 1.000 |