 64
64peptides
spectra
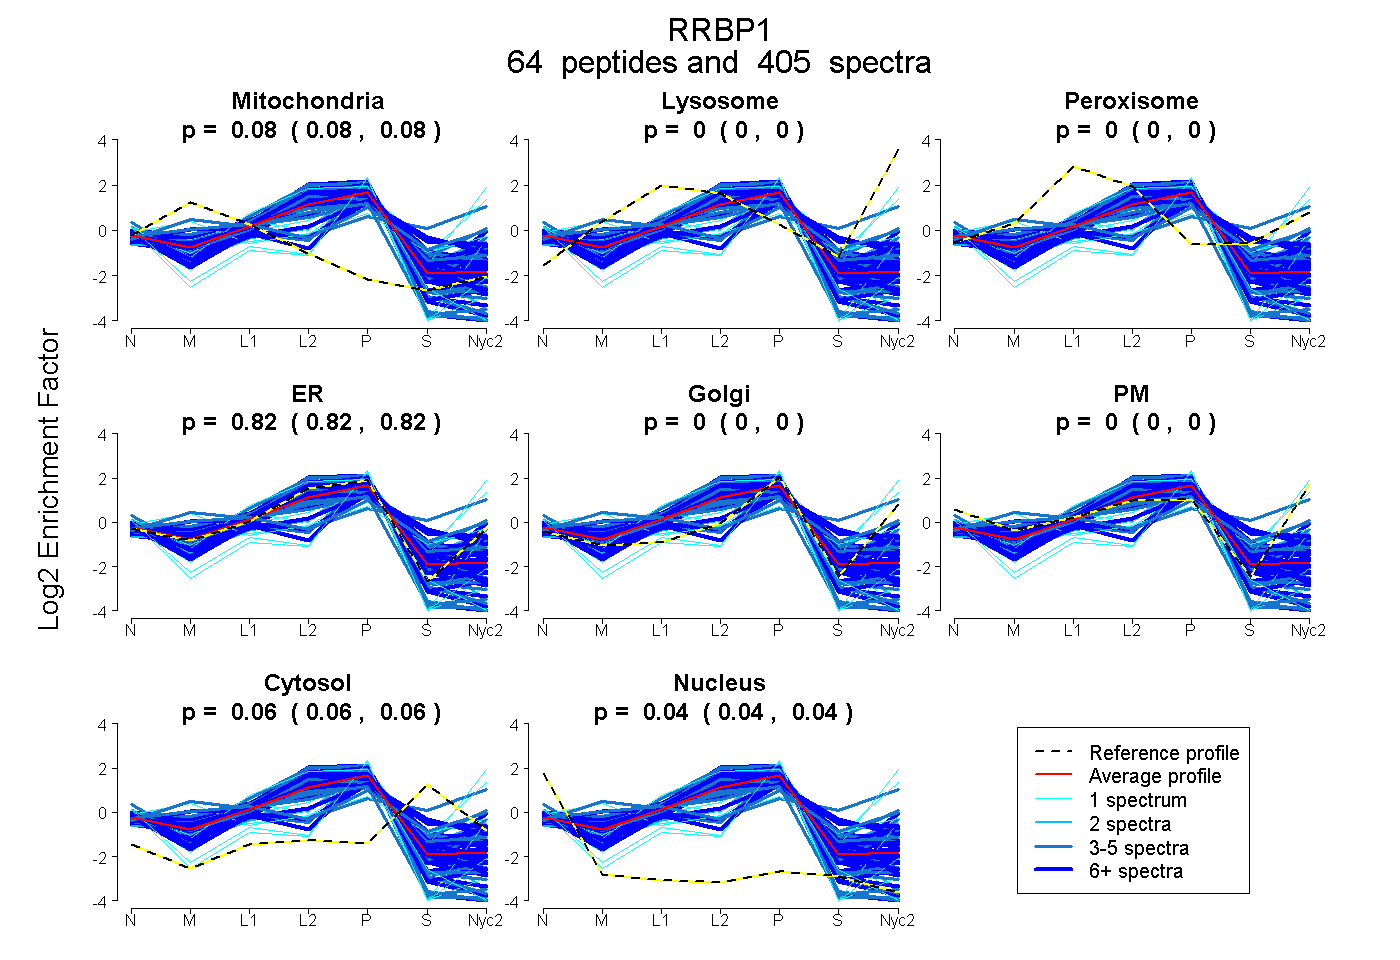
0.075 | 0.078
0.000 | 0.000
0.000 | 0.000
0.817 | 0.819
0.000 | 0.000
0.000 | 0.000
0.060 | 0.063
0.042 | 0.045
50peptides
spectra
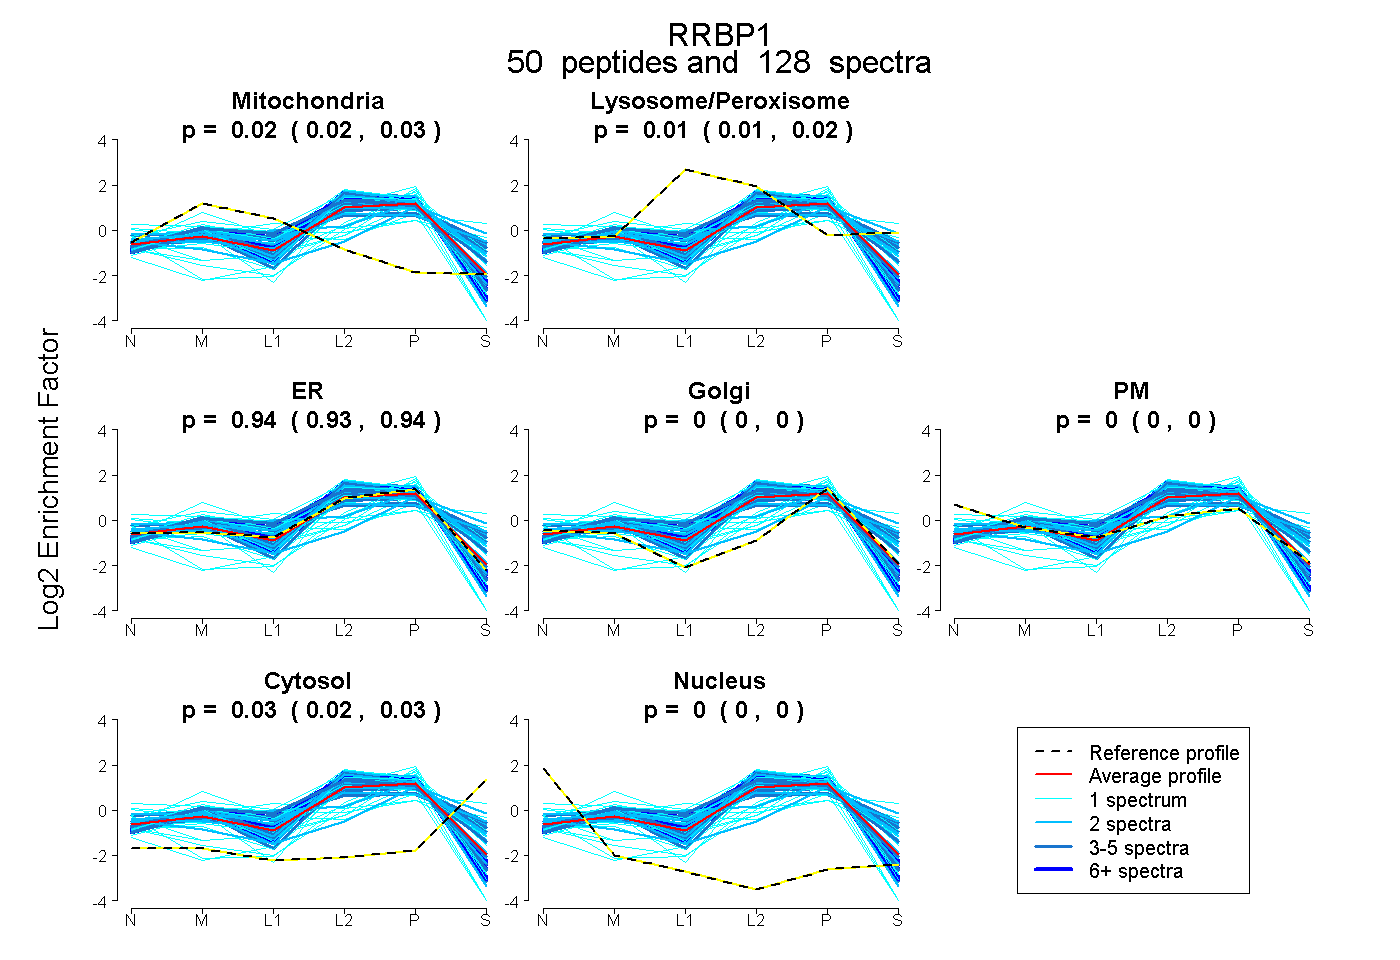
0.017 | 0.026
0.007 | 0.015
0.934 | 0.942
0.000 | 0.000
0.000 | 0.000
0.024 | 0.032
0.000 | 0.000
76peptides
spectra
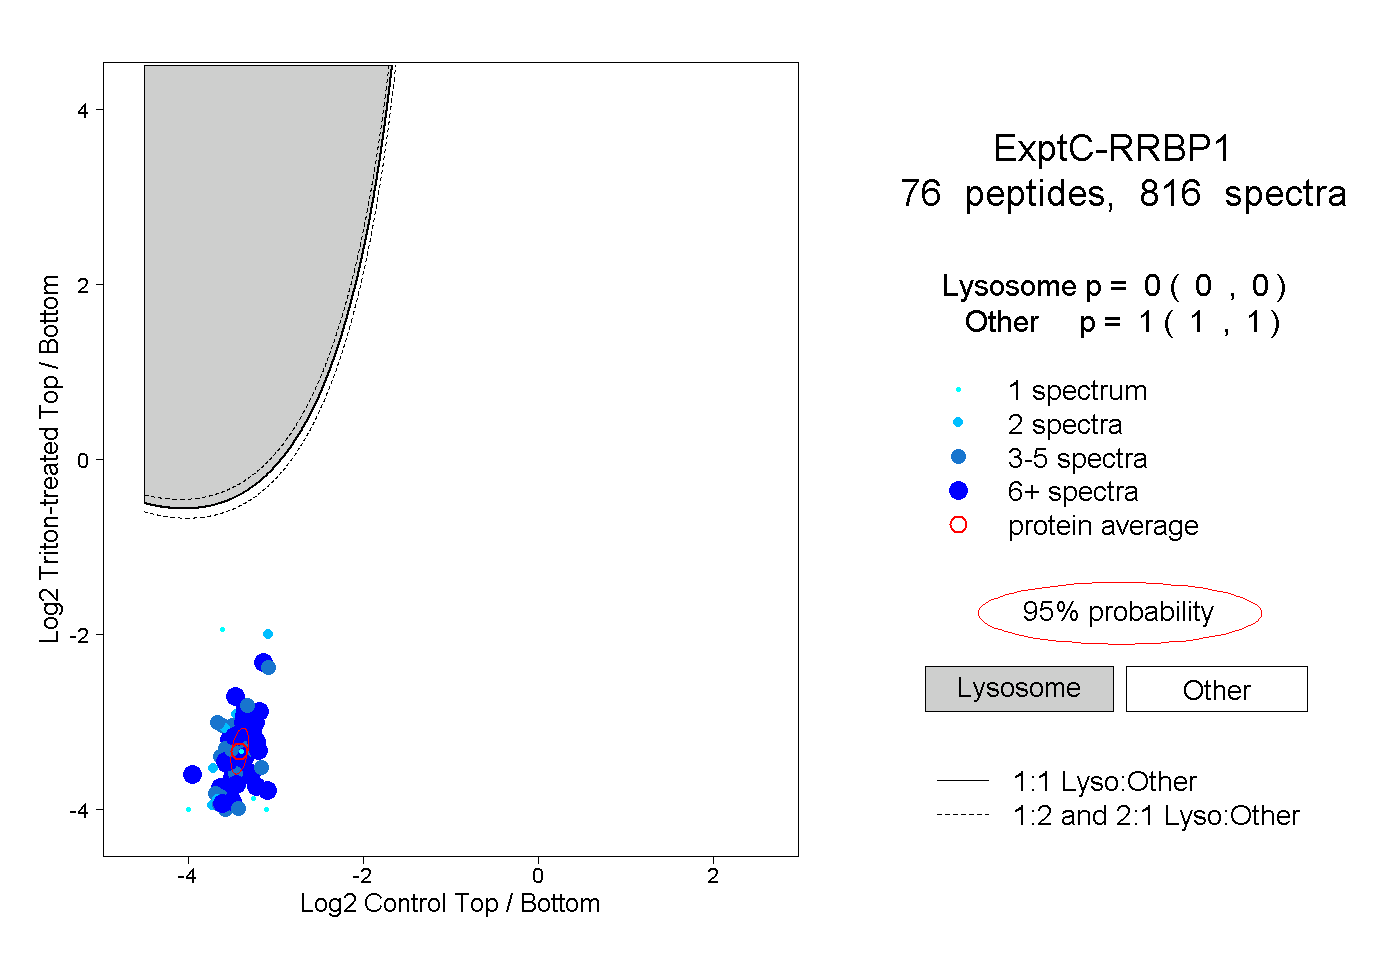
0.000 | 0.000
1.000 | 1.000
36peptides
spectra
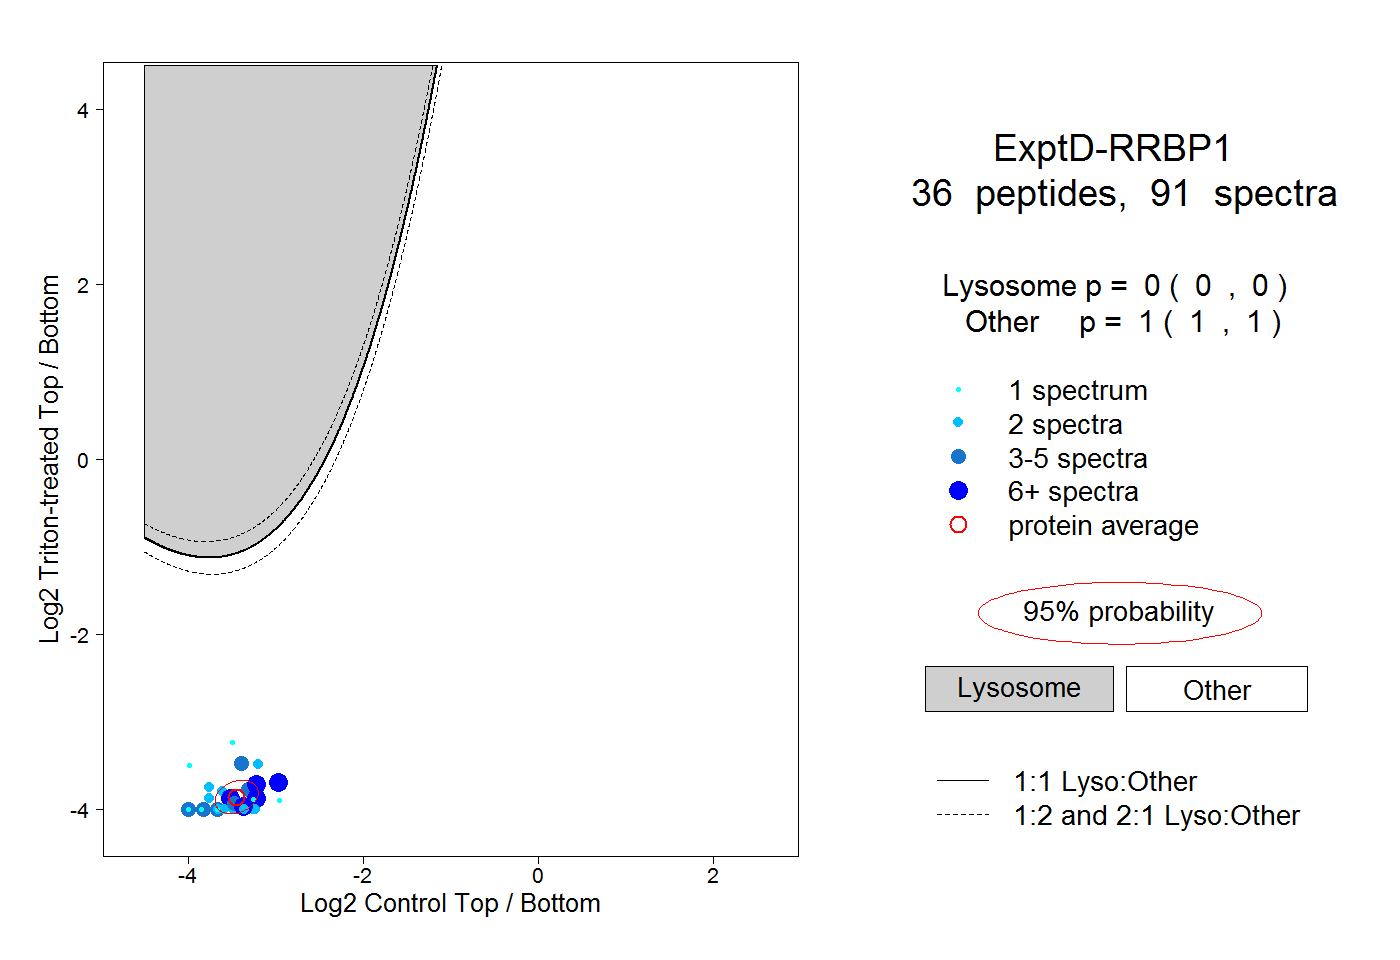
0.000 | 0.000
1.000 | 1.000