 9
9peptides
spectra
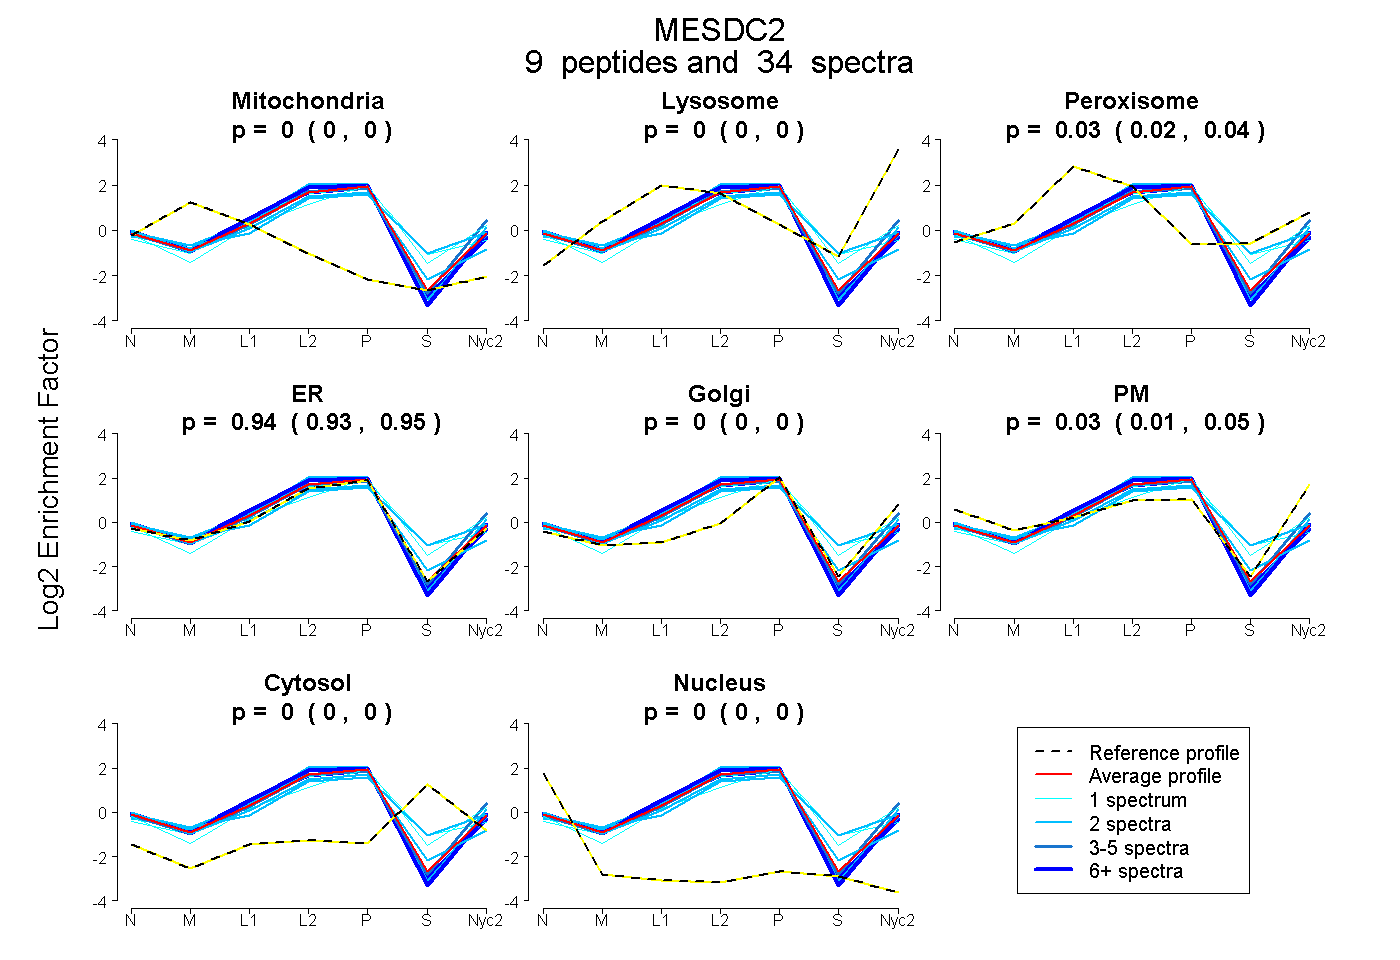
0.000 | 0.000
0.000 | 0.000
0.015 | 0.036
0.926 | 0.954
0.000 | 0.000
0.014 | 0.046
0.000 | 0.000
0.000 | 0.000
3peptides
spectra
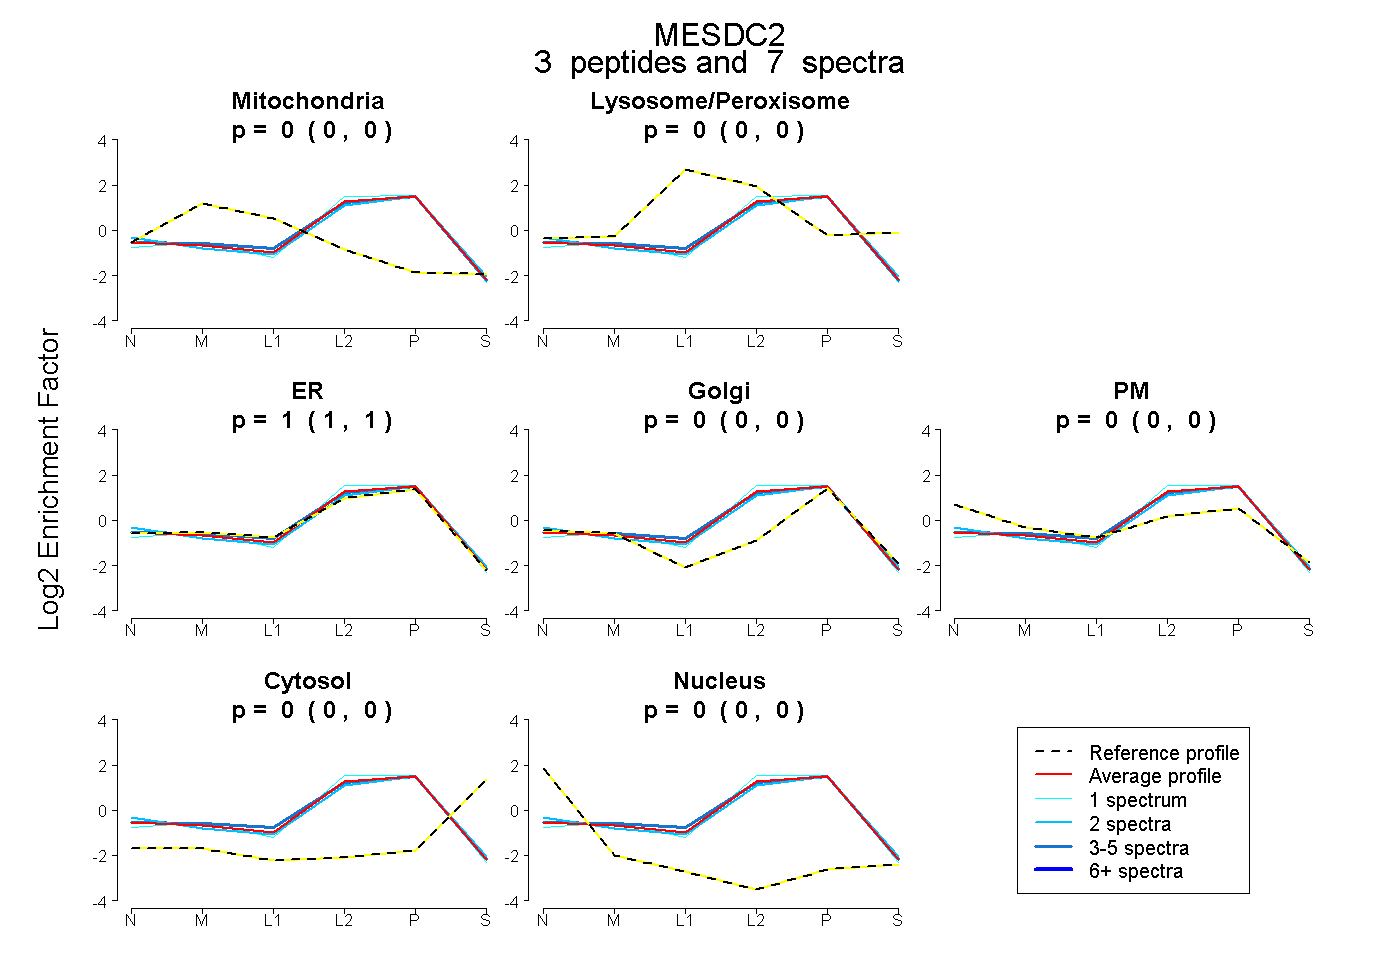
0.000 | 0.000
0.000 | 0.000
1.000 | 1.000
0.000 | 0.000
0.000 | 0.000
0.000 | 0.000
0.000 | 0.000
7peptides
spectra
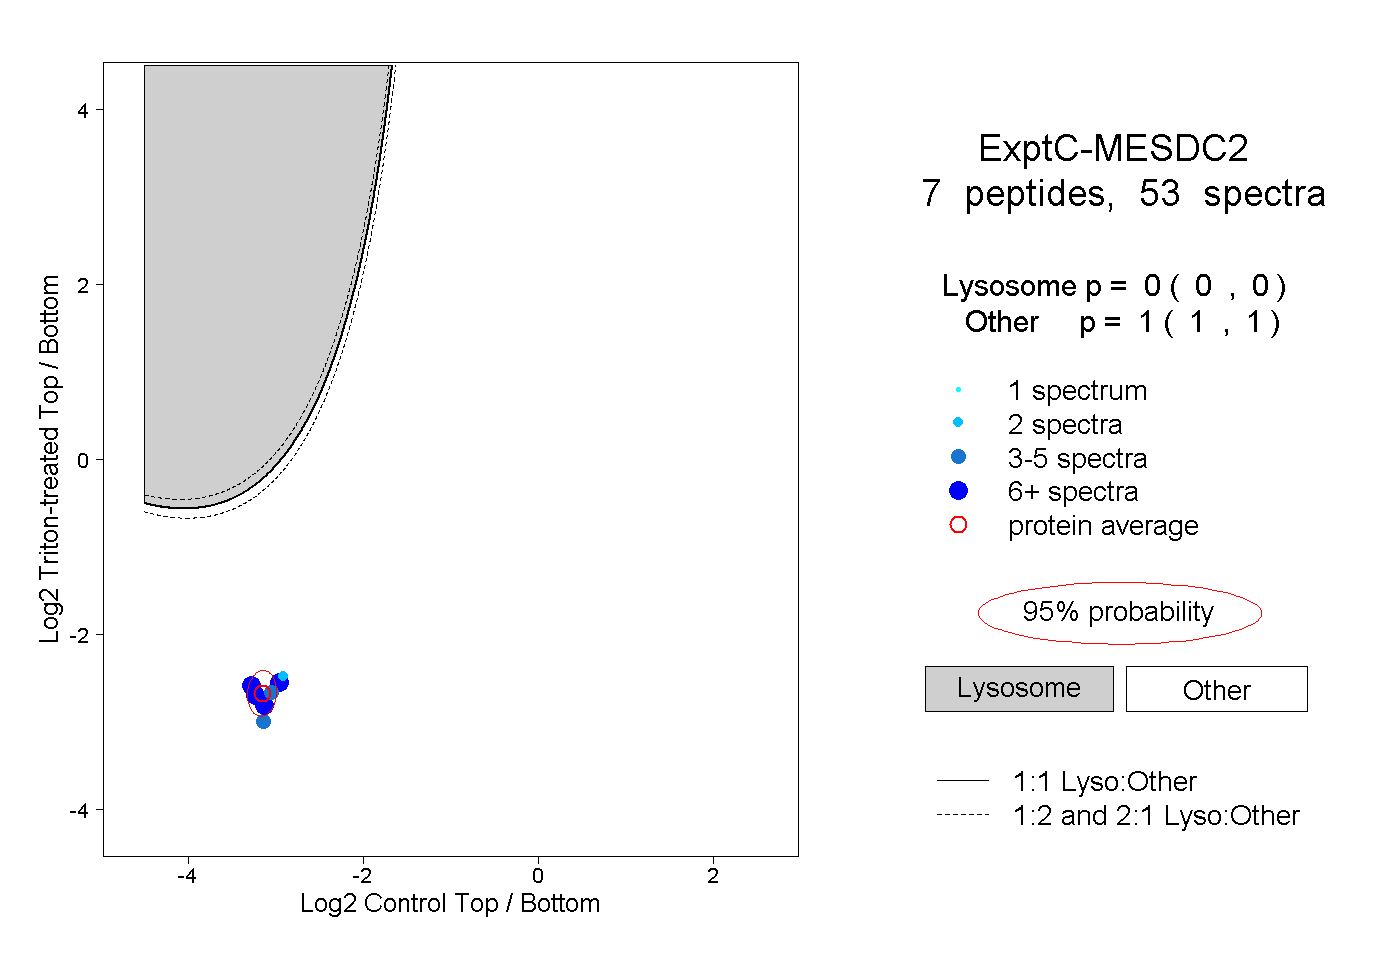
0.000 | 0.000
1.000 | 1.000
2peptides
spectra
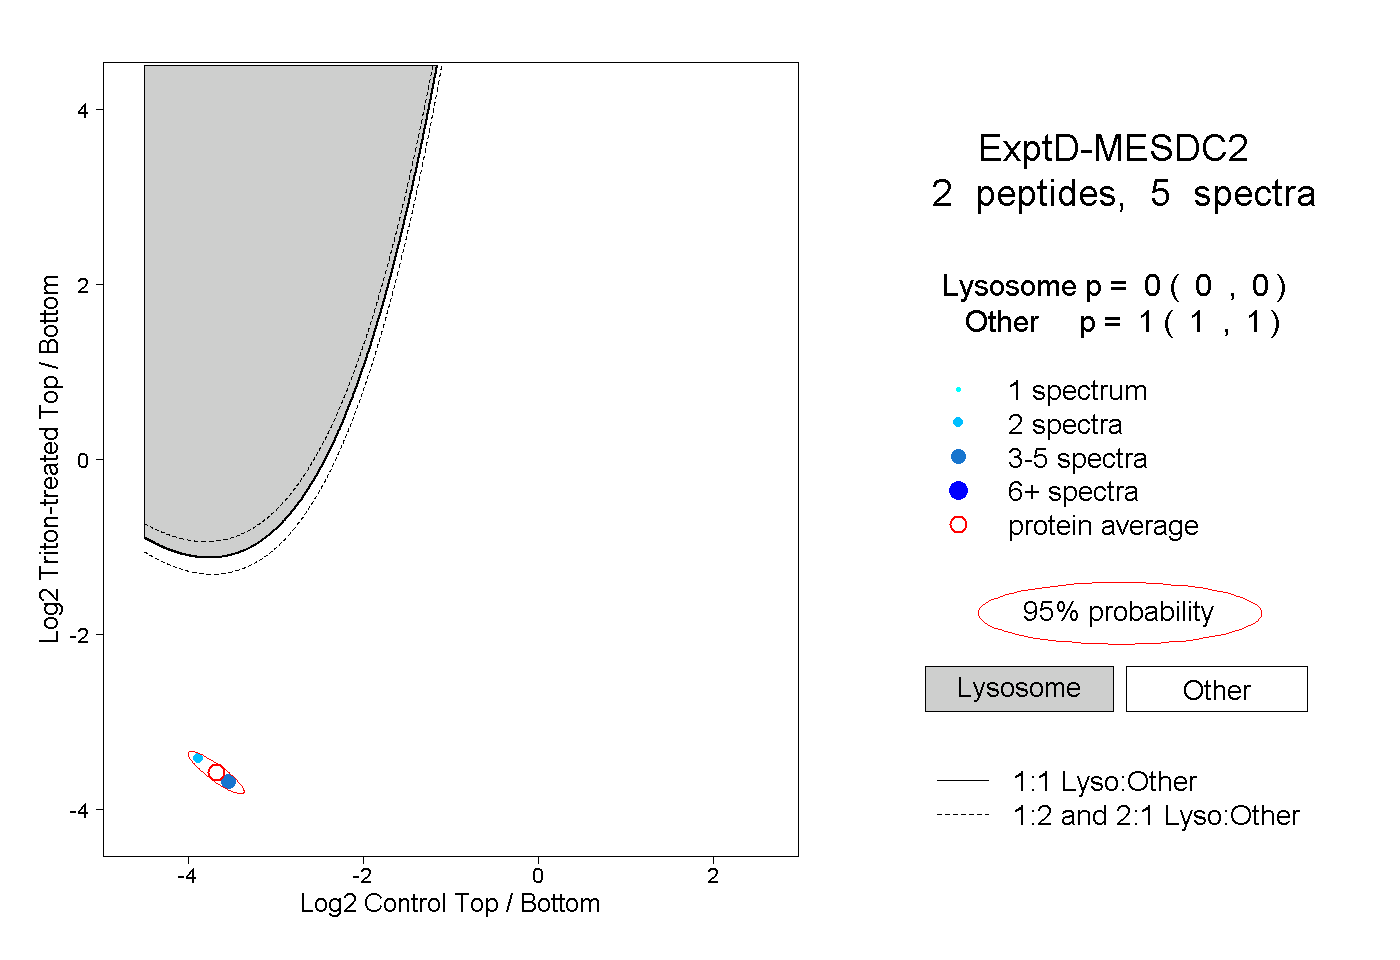
0.000 | 0.000
1.000 | 1.000