 9
9peptides
spectra
0.000 | 0.000
0.000 | 0.000
0.015 | 0.036
0.926 | 0.954
0.000 | 0.000
0.014 | 0.046
0.000 | 0.000
0.000 | 0.000
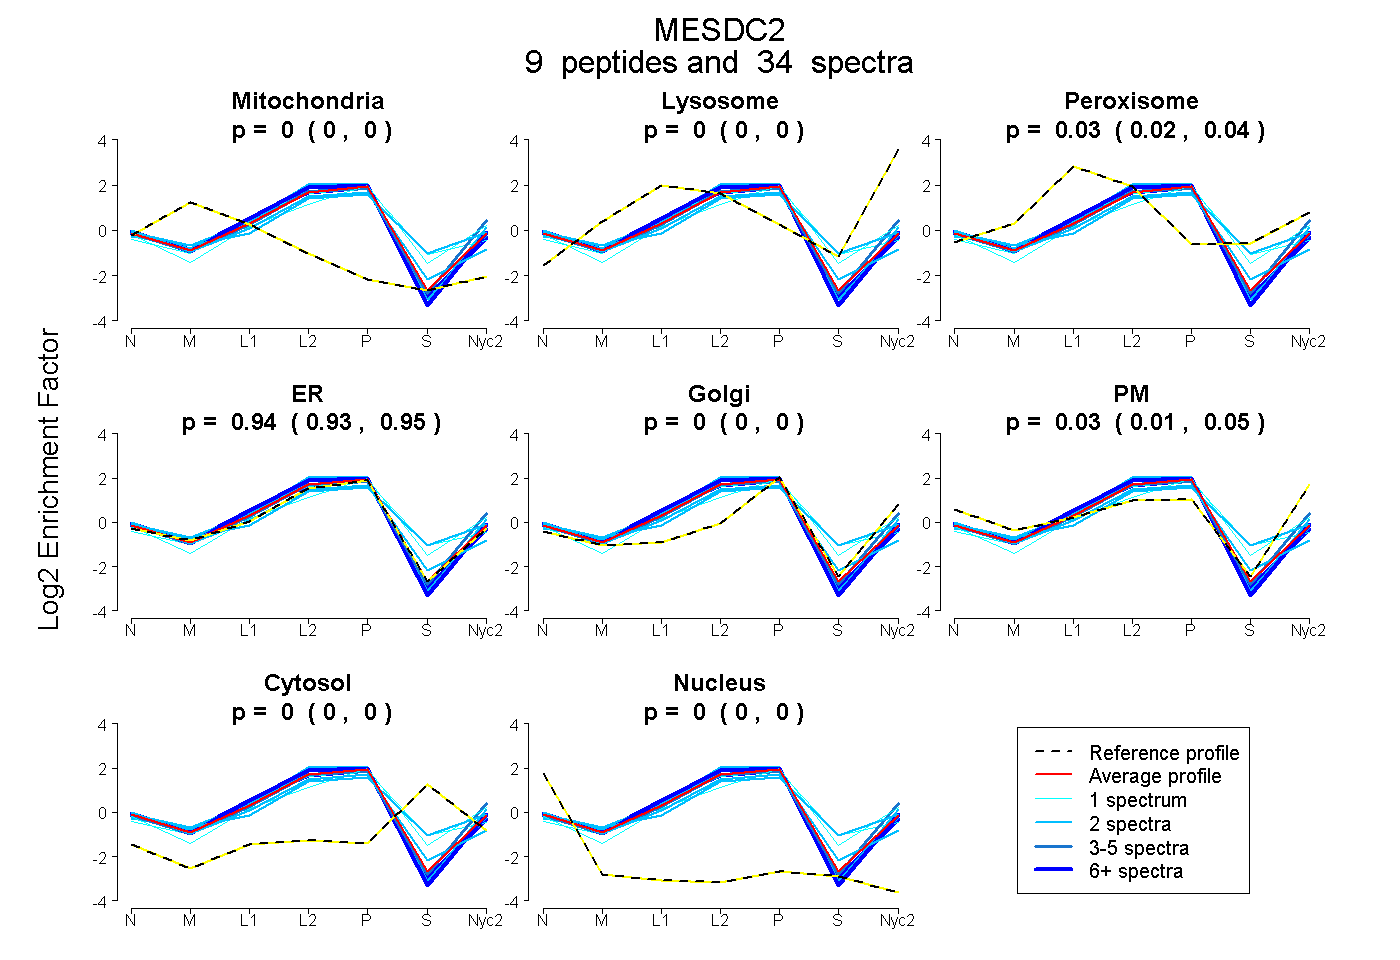
| Plot | Mito | Lyso | Perox | ER | Golgi | PM | Cytosol | Nucleus | |||||
| Expt A |
9 peptides |
34 spectra |
|
0.000 0.000 | 0.000 |
0.000 0.000 | 0.000 |
0.027 0.015 | 0.036 |
0.941 0.926 | 0.954 |
0.000 0.000 | 0.000 |
0.032 0.014 | 0.046 |
0.000 0.000 | 0.000 |
0.000 0.000 | 0.000 |
| 1 spectrum, LDPGKPESILK | 0.000 | 0.046 | 0.040 | 0.634 | 0.177 | 0.000 | 0.103 | 0.000 | ||
| 1 spectrum, DGSYAWEIK | 0.000 | 0.000 | 0.173 | 0.717 | 0.000 | 0.000 | 0.110 | 0.000 | ||
| 14 spectra, DYNDADMAR | 0.000 | 0.000 | 0.000 | 0.973 | 0.000 | 0.027 | 0.000 | 0.000 | ||
| 7 spectra, AIFMLR | 0.000 | 0.000 | 0.030 | 0.970 | 0.000 | 0.000 | 0.000 | 0.000 | ||
| 2 spectra, DFLVNQDR | 0.000 | 0.036 | 0.000 | 0.933 | 0.000 | 0.031 | 0.000 | 0.000 | ||
| 2 spectra, RPSAPIDFSK | 0.000 | 0.000 | 0.039 | 0.894 | 0.000 | 0.000 | 0.023 | 0.044 | ||
| 2 spectra, LLEQWEK | 0.000 | 0.000 | 0.097 | 0.675 | 0.000 | 0.067 | 0.161 | 0.000 | ||
| 2 spectra, DDDIEEGDLPEHK | 0.000 | 0.000 | 0.005 | 0.995 | 0.000 | 0.000 | 0.000 | 0.000 | ||
| 3 spectra, FIVGSDR | 0.000 | 0.038 | 0.000 | 0.787 | 0.000 | 0.175 | 0.000 | 0.000 |
| Plot | Mito | Lyso or Perox | ER | Golgi | PM | Cytosol | Nucleus | ||||||
| Expt B |
3 peptides |
7 spectra |
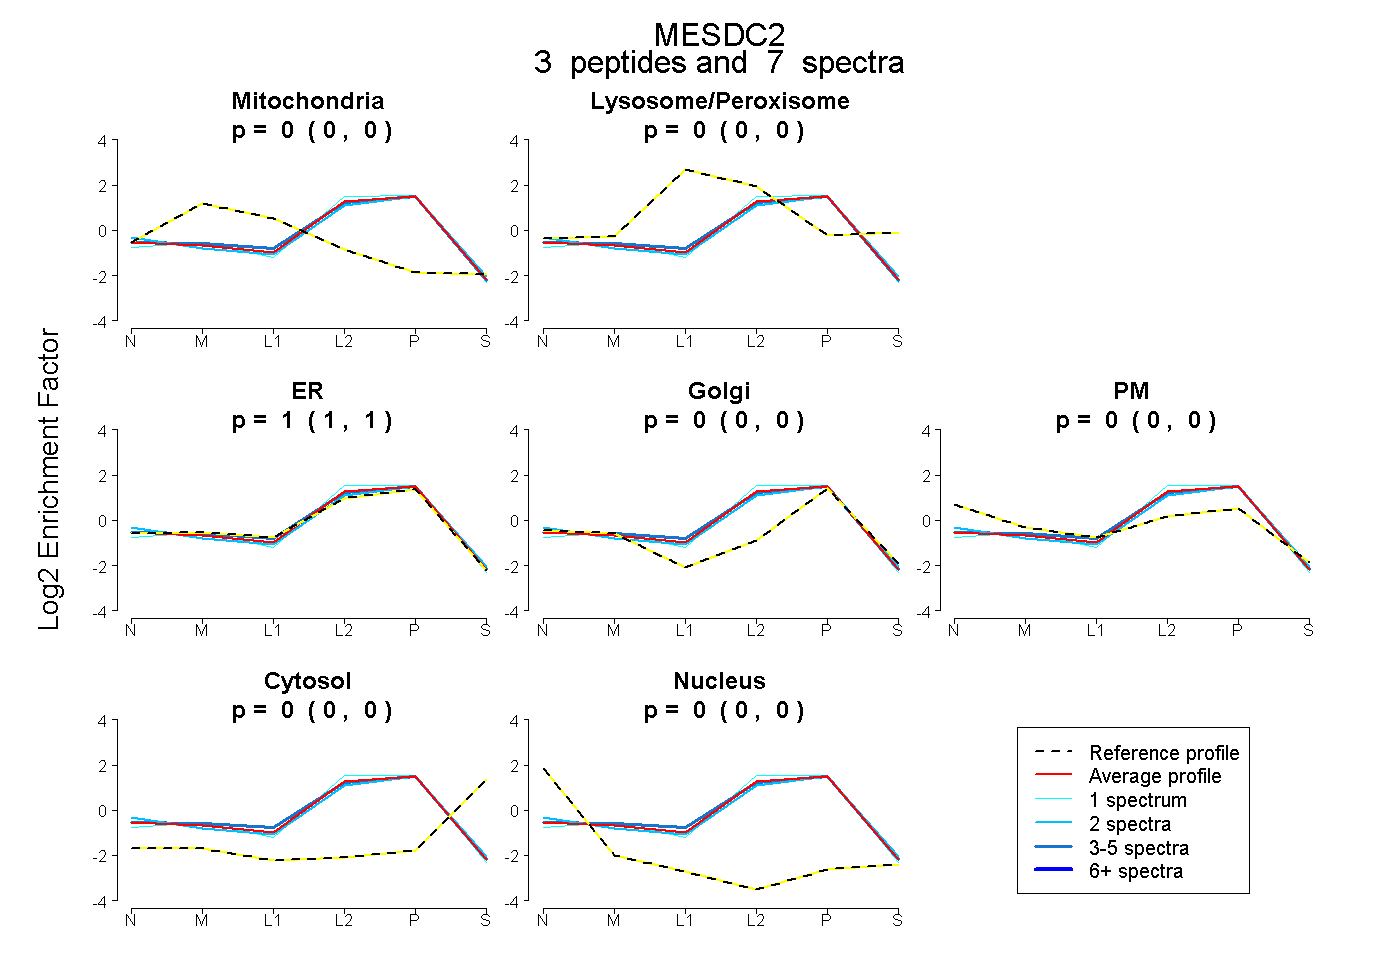 |
0.000 0.000 | 0.000 |
0.000 0.000 | 0.000 |
1.000 1.000 | 1.000 |
0.000 0.000 | 0.000 |
0.000 0.000 | 0.000 |
0.000 0.000 | 0.000 |
0.000 0.000 | 0.000 |
|||
| Plot | Lyso | Other | |||||||||||
| Expt C |
7 peptides |
53 spectra |
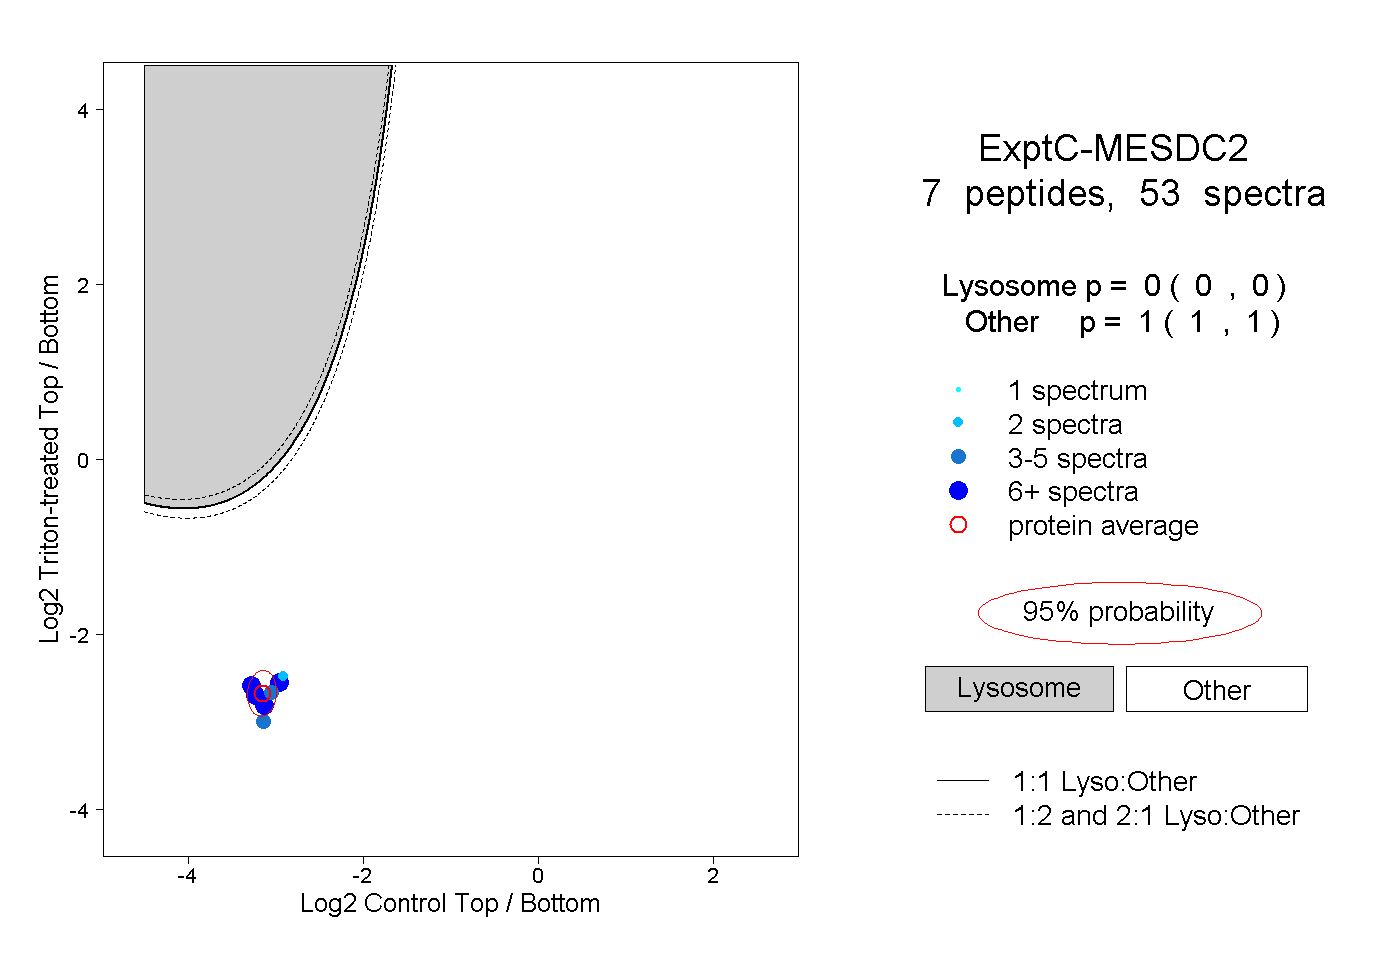 |
0.000 0.000 | 0.000 |
1.000 1.000 | 1.000 |
||||||||
| Plot | Lyso | Other | |||||||||||
| Expt D |
2 peptides |
5 spectra |
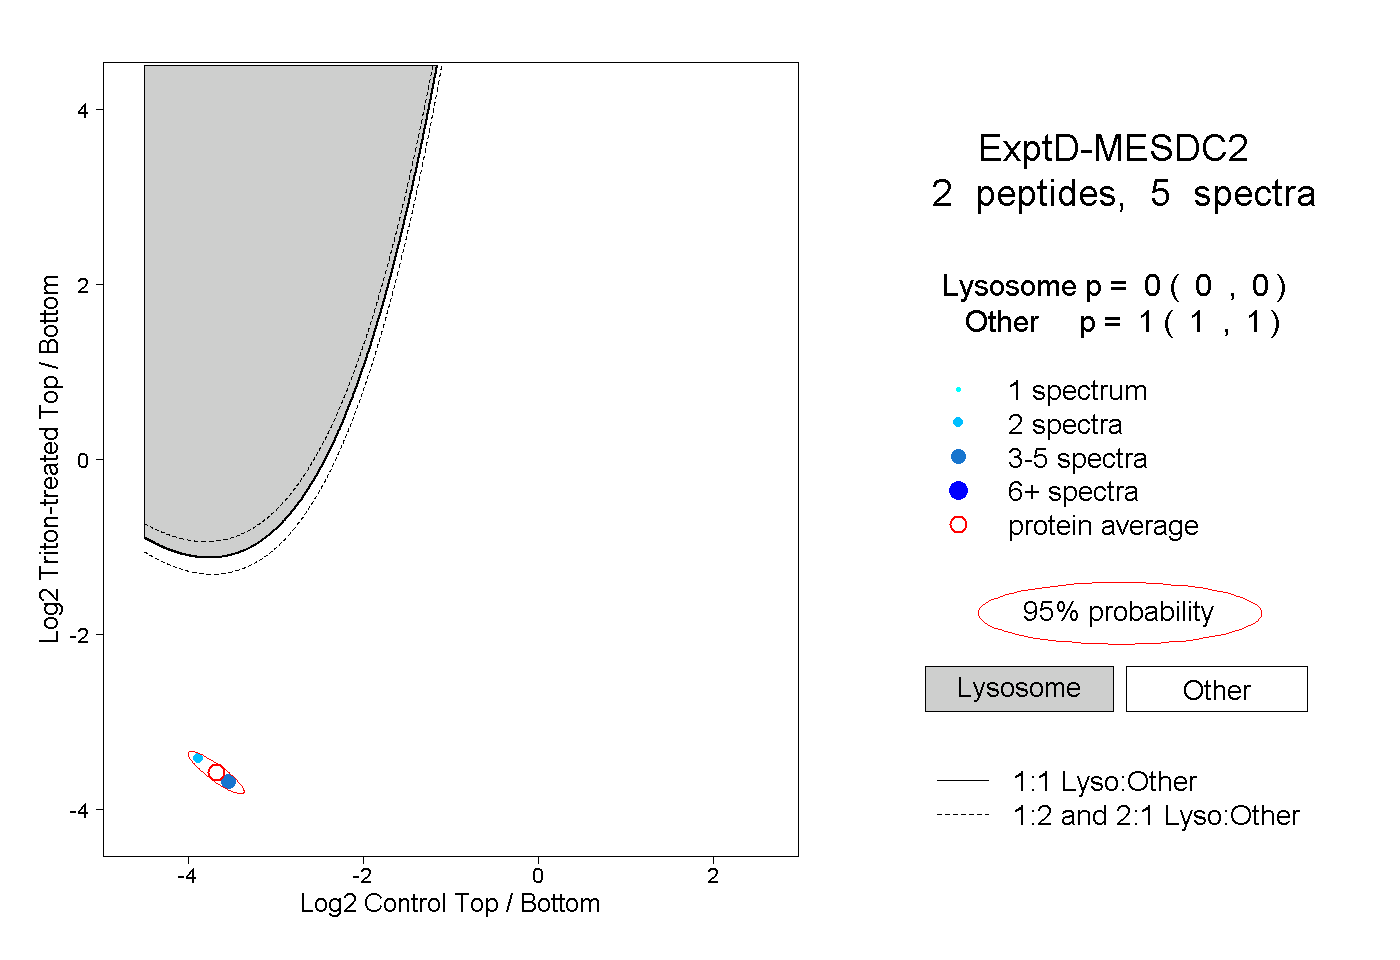 |
0.000 0.000 | 0.000 |
1.000 1.000 | 1.000 |