 7
7peptides
spectra
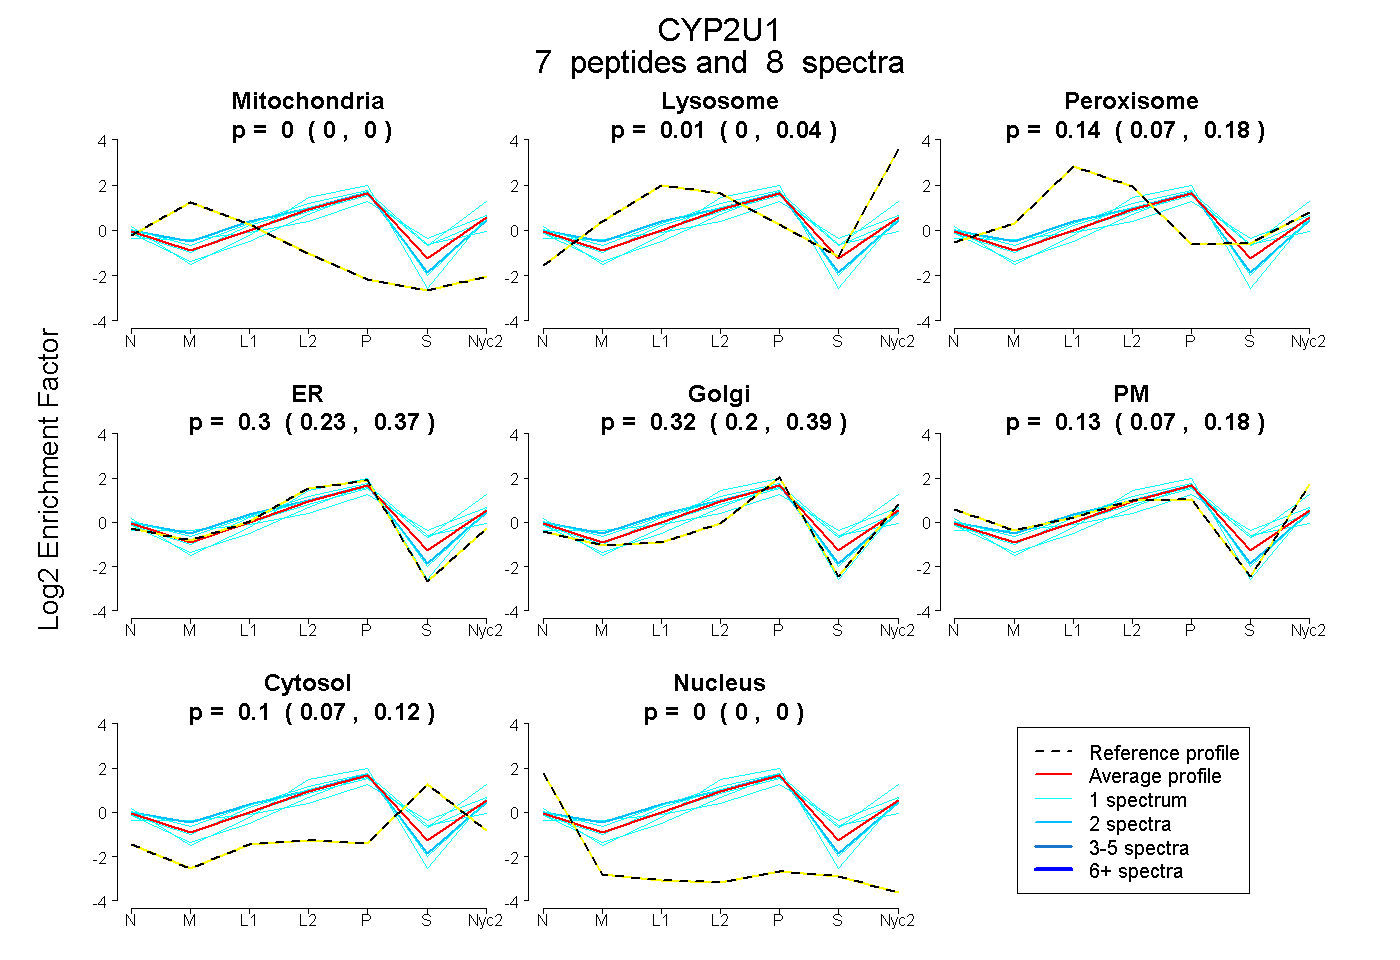
0.000 | 0.000
0.000 | 0.044
0.072 | 0.182
0.233 | 0.374
0.204 | 0.392
0.074 | 0.177
0.071 | 0.124
0.000 | 0.000
1peptide
spectrum
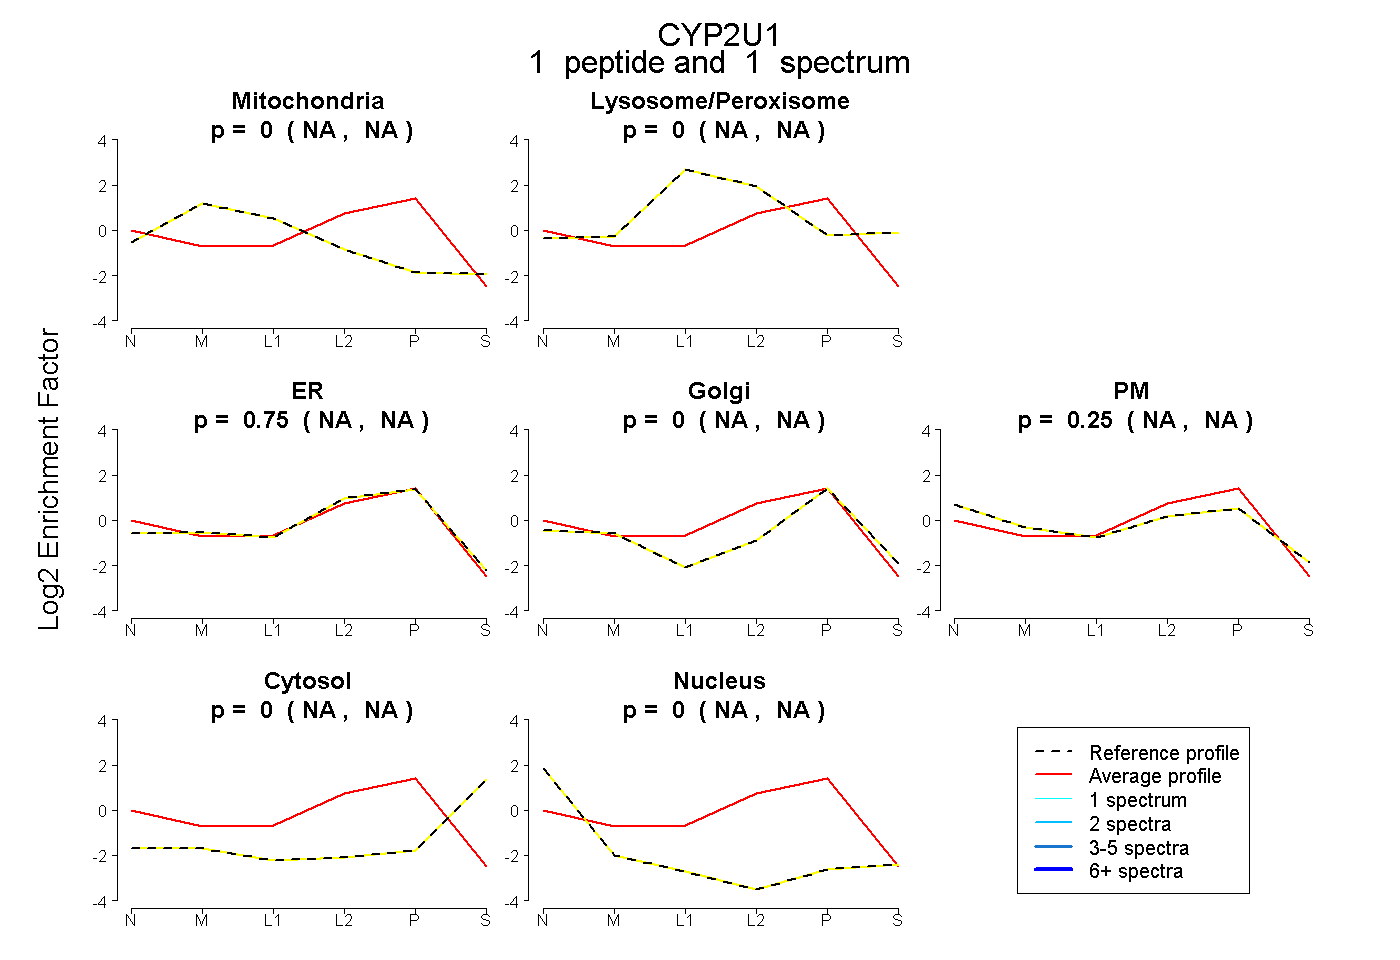
NA | NA
NA | NA
NA | NA
NA | NA
NA | NA
NA | NA
NA | NA
1peptide
spectrum
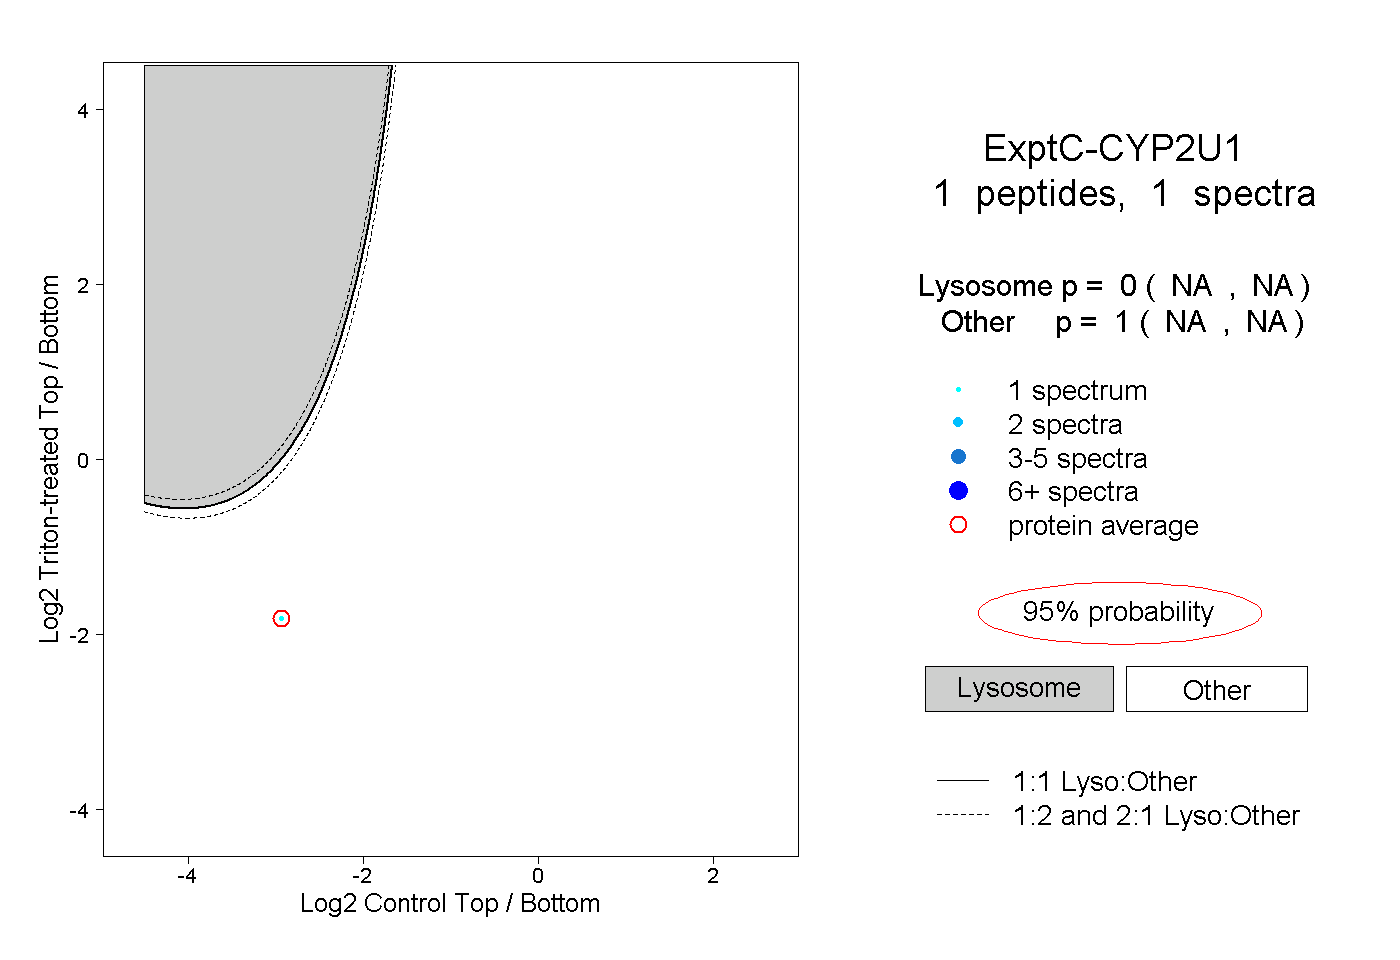
NA | NA
NA | NA