 19
19peptides
spectra
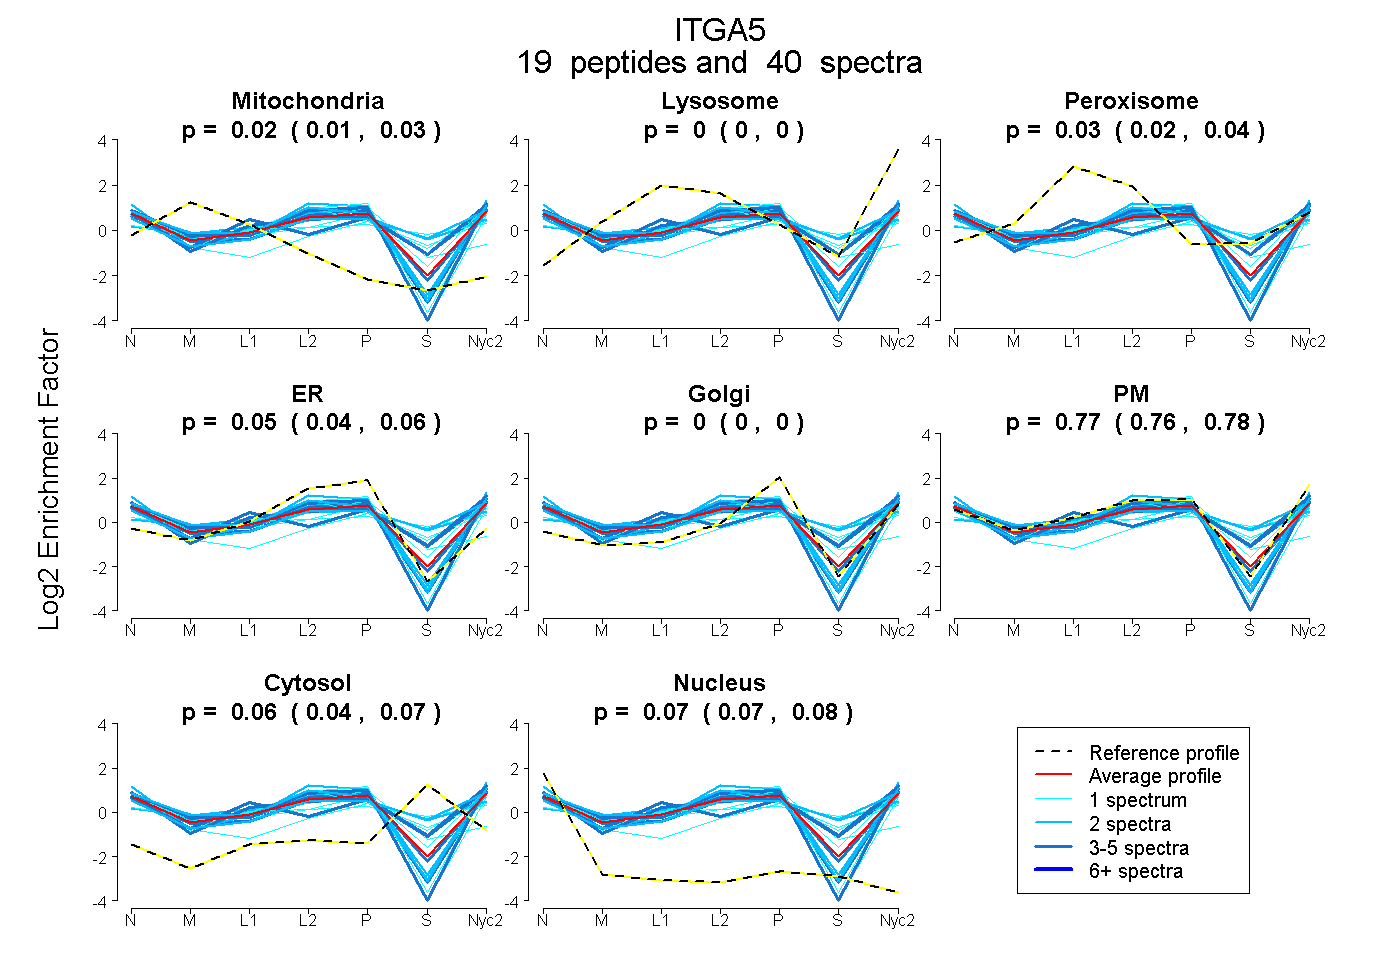
0.009 | 0.026
0.000 | 0.000
0.017 | 0.039
0.041 | 0.064
0.000 | 0.000
0.756 | 0.782
0.041 | 0.069
0.065 | 0.079
4peptides
spectra
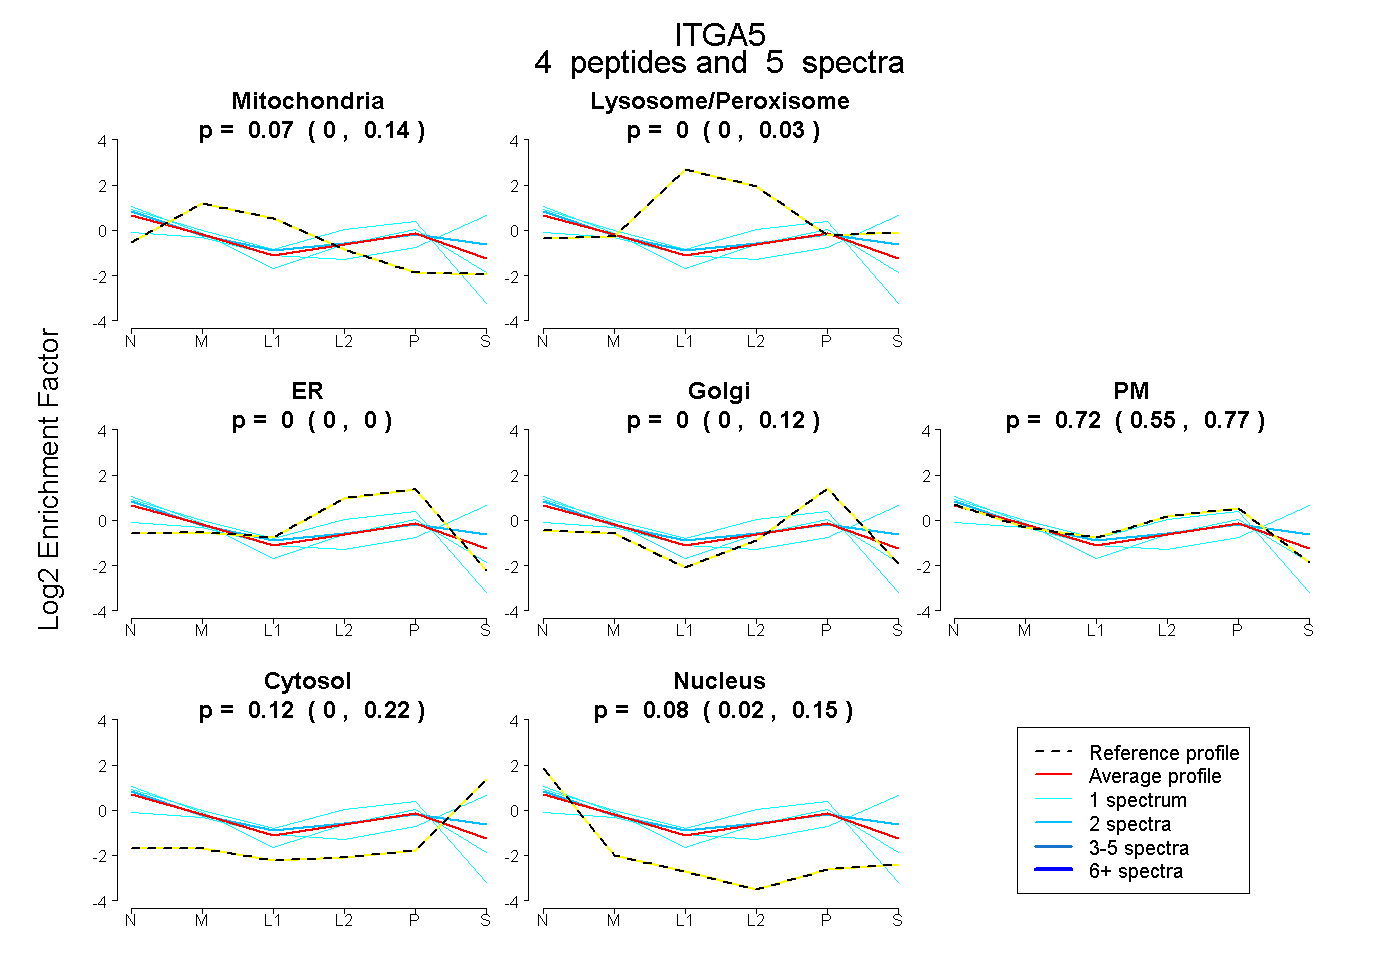
0.003 | 0.140
0.000 | 0.028
0.000 | 0.000
0.000 | 0.123
0.550 | 0.766
0.000 | 0.219
0.018 | 0.146
10peptides
spectra
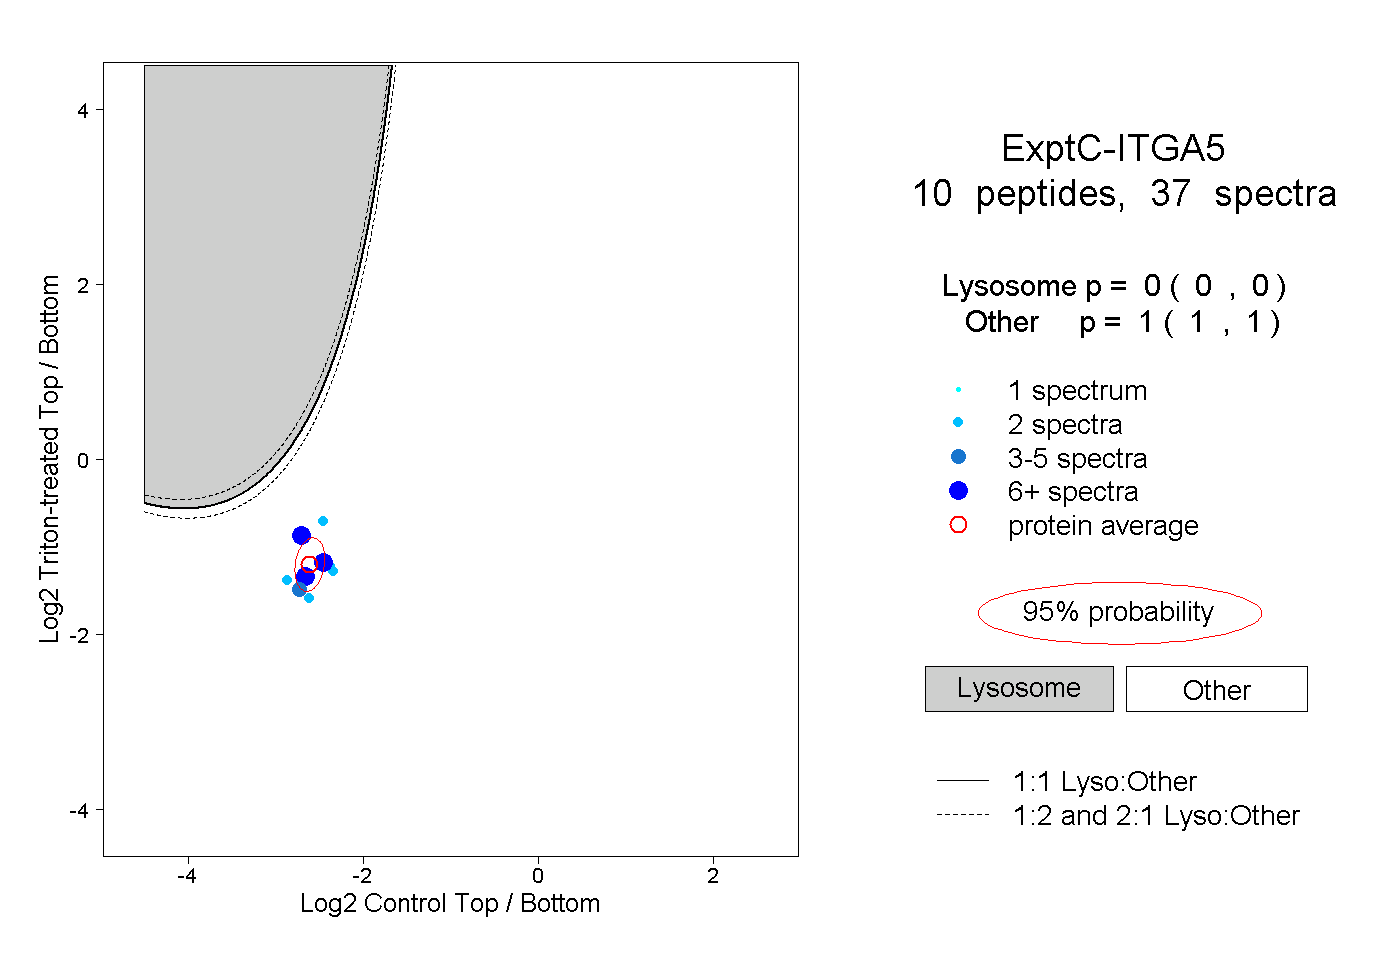
0.000 | 0.000
1.000 | 1.000
2peptides
spectra
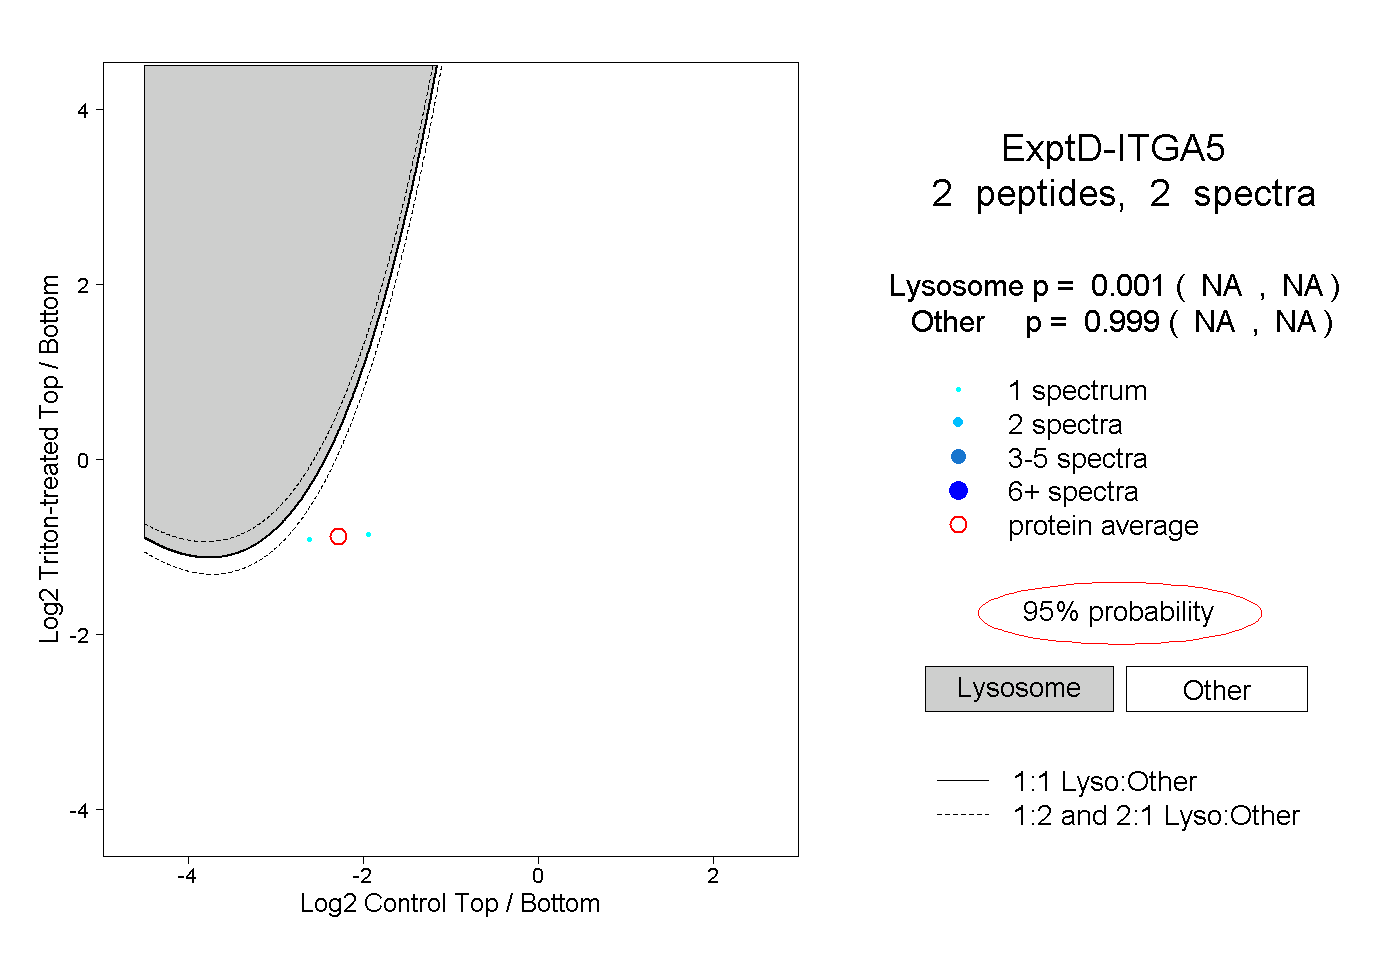
NA | NA
NA | NA