 19
19peptides
spectra
0.009 | 0.026
0.000 | 0.000
0.017 | 0.039
0.041 | 0.064
0.000 | 0.000
0.756 | 0.782
0.041 | 0.069
0.065 | 0.079
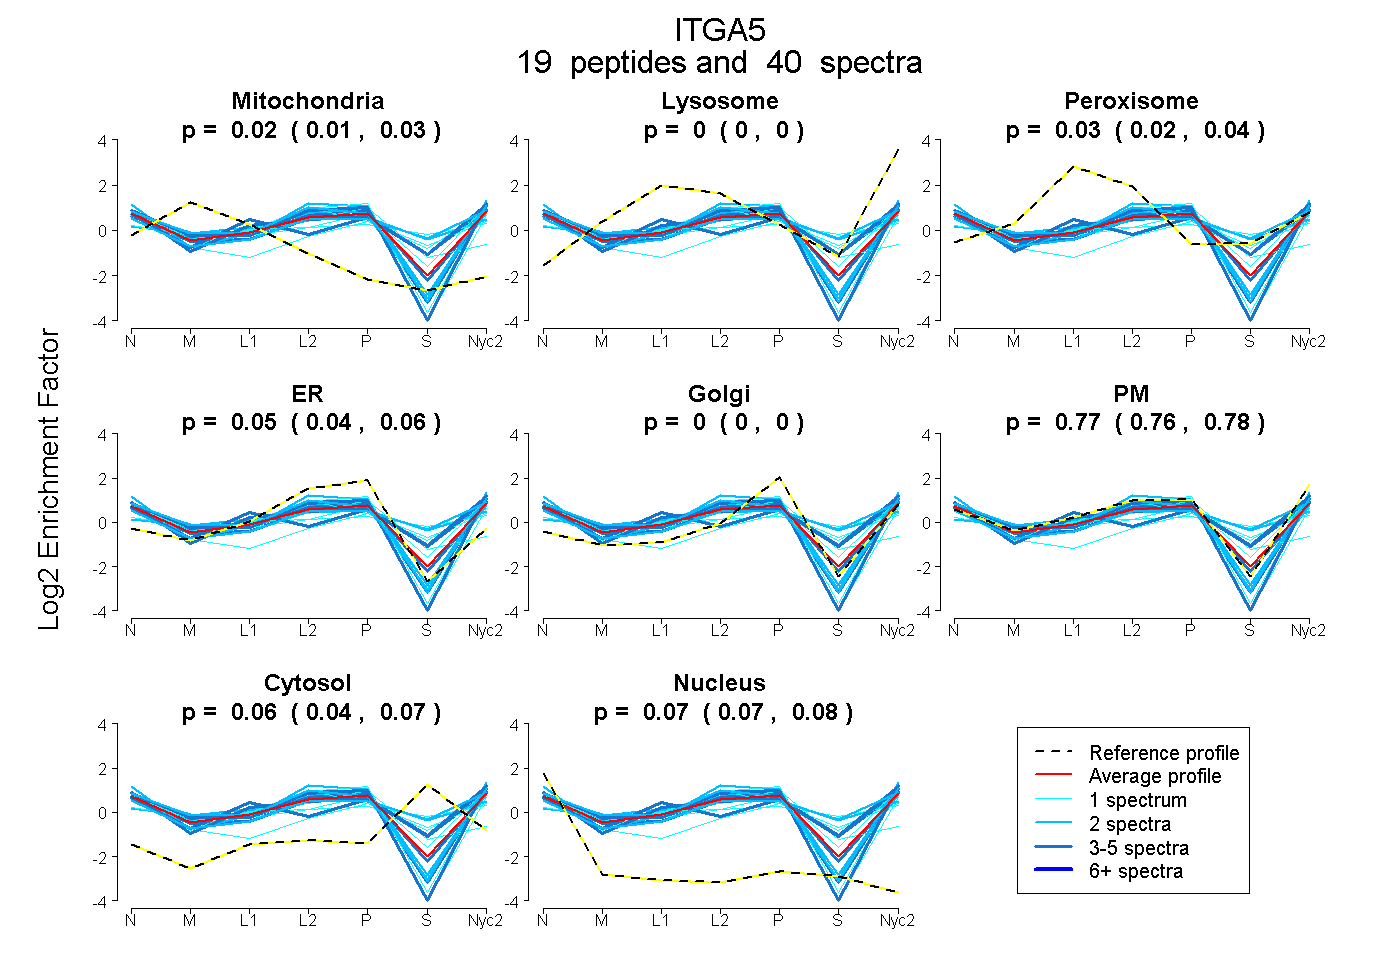
| Plot | Mito | Lyso | Perox | ER | Golgi | PM | Cytosol | Nucleus | |||||
| Expt A |
19 peptides |
40 spectra |
|
0.018 0.009 | 0.026 |
0.000 0.000 | 0.000 |
0.029 0.017 | 0.039 |
0.053 0.041 | 0.064 |
0.000 0.000 | 0.000 |
0.770 0.756 | 0.782 |
0.057 0.041 | 0.069 |
0.073 0.065 | 0.079 |
| 3 spectra, SSTTSGTQVLK | 0.000 | 0.000 | 0.064 | 0.000 | 0.000 | 0.728 | 0.207 | 0.000 | ||
| 4 spectra, SLQWFGATVR | 0.000 | 0.000 | 0.000 | 0.106 | 0.000 | 0.832 | 0.000 | 0.062 | ||
| 2 spectra, VTAPLEAEYSGLVR | 0.000 | 0.000 | 0.057 | 0.000 | 0.000 | 0.620 | 0.322 | 0.000 | ||
| 1 spectrum, SLPYGTAMEK | 0.035 | 0.000 | 0.007 | 0.000 | 0.000 | 0.799 | 0.127 | 0.031 | ||
| 1 spectrum, QLVCDLGNPMK | 0.004 | 0.000 | 0.000 | 0.191 | 0.000 | 0.768 | 0.000 | 0.037 | ||
| 1 spectrum, LGFFK | 0.000 | 0.000 | 0.000 | 0.000 | 0.042 | 0.560 | 0.302 | 0.096 | ||
| 1 spectrum, AQLKPPATSDA | 0.000 | 0.000 | 0.000 | 0.192 | 0.000 | 0.681 | 0.000 | 0.127 | ||
| 2 spectra, DGVSVLVGAPK | 0.028 | 0.000 | 0.000 | 0.176 | 0.000 | 0.729 | 0.000 | 0.067 | ||
| 1 spectrum, SDFGSAAGQGYCQGGFSAEFTK | 0.000 | 0.000 | 0.193 | 0.464 | 0.006 | 0.108 | 0.101 | 0.127 | ||
| 3 spectra, AGTSIWGGLR | 0.039 | 0.000 | 0.000 | 0.076 | 0.000 | 0.835 | 0.000 | 0.050 | ||
| 4 spectra, SLQLHFR | 0.000 | 0.000 | 0.099 | 0.000 | 0.000 | 0.669 | 0.209 | 0.023 | ||
| 2 spectra, CEFGPLHR | 0.009 | 0.000 | 0.259 | 0.000 | 0.127 | 0.359 | 0.246 | 0.000 | ||
| 4 spectra, ALFLASK | 0.000 | 0.000 | 0.000 | 0.000 | 0.000 | 0.766 | 0.229 | 0.005 | ||
| 2 spectra, TADGRPQEVGR | 0.060 | 0.000 | 0.000 | 0.056 | 0.000 | 0.845 | 0.000 | 0.039 | ||
| 1 spectrum, ILEYAPCR | 0.061 | 0.000 | 0.133 | 0.000 | 0.000 | 0.462 | 0.344 | 0.000 | ||
| 3 spectra, FTVPHLQDTK | 0.086 | 0.000 | 0.000 | 0.072 | 0.059 | 0.736 | 0.014 | 0.033 | ||
| 2 spectra, MPYQILPR | 0.000 | 0.000 | 0.000 | 0.000 | 0.000 | 0.882 | 0.000 | 0.118 | ||
| 1 spectrum, ILESSLYSEEPVEYK | 0.000 | 0.000 | 0.176 | 0.000 | 0.000 | 0.624 | 0.200 | 0.000 | ||
| 2 spectra, NESEFR | 0.020 | 0.000 | 0.000 | 0.119 | 0.000 | 0.847 | 0.000 | 0.013 |
| Plot | Mito | Lyso or Perox | ER | Golgi | PM | Cytosol | Nucleus | ||||||
| Expt B |
4 peptides |
5 spectra |
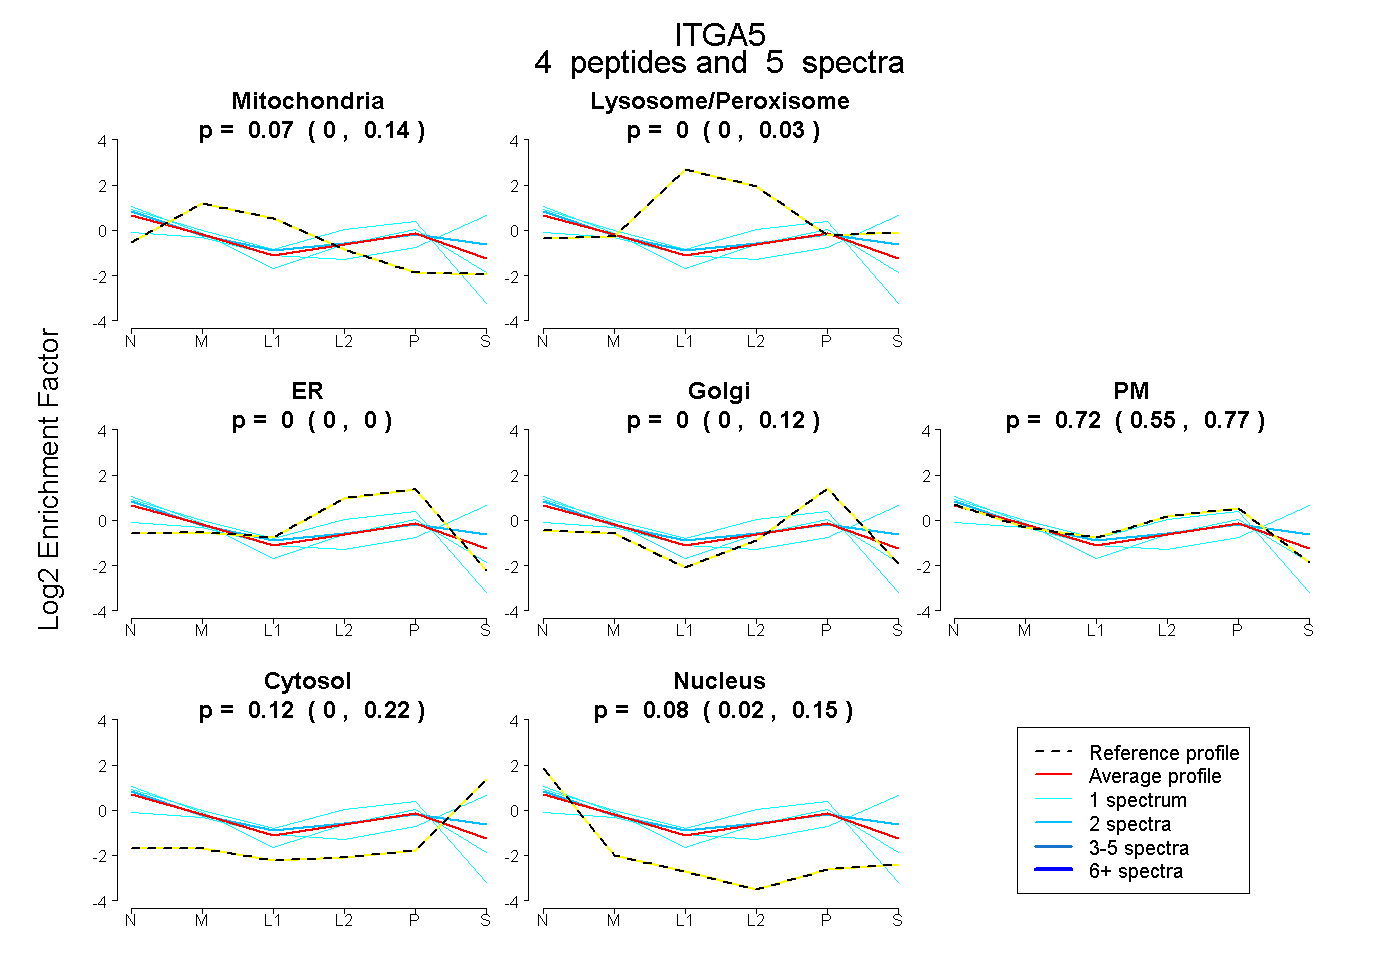 |
0.072 0.003 | 0.140 |
0.000 0.000 | 0.028 |
0.000 0.000 | 0.000 |
0.000 0.000 | 0.123 |
0.720 0.550 | 0.766 |
0.123 0.000 | 0.219 |
0.085 0.018 | 0.146 |
|||
| Plot | Lyso | Other | |||||||||||
| Expt C |
10 peptides |
37 spectra |
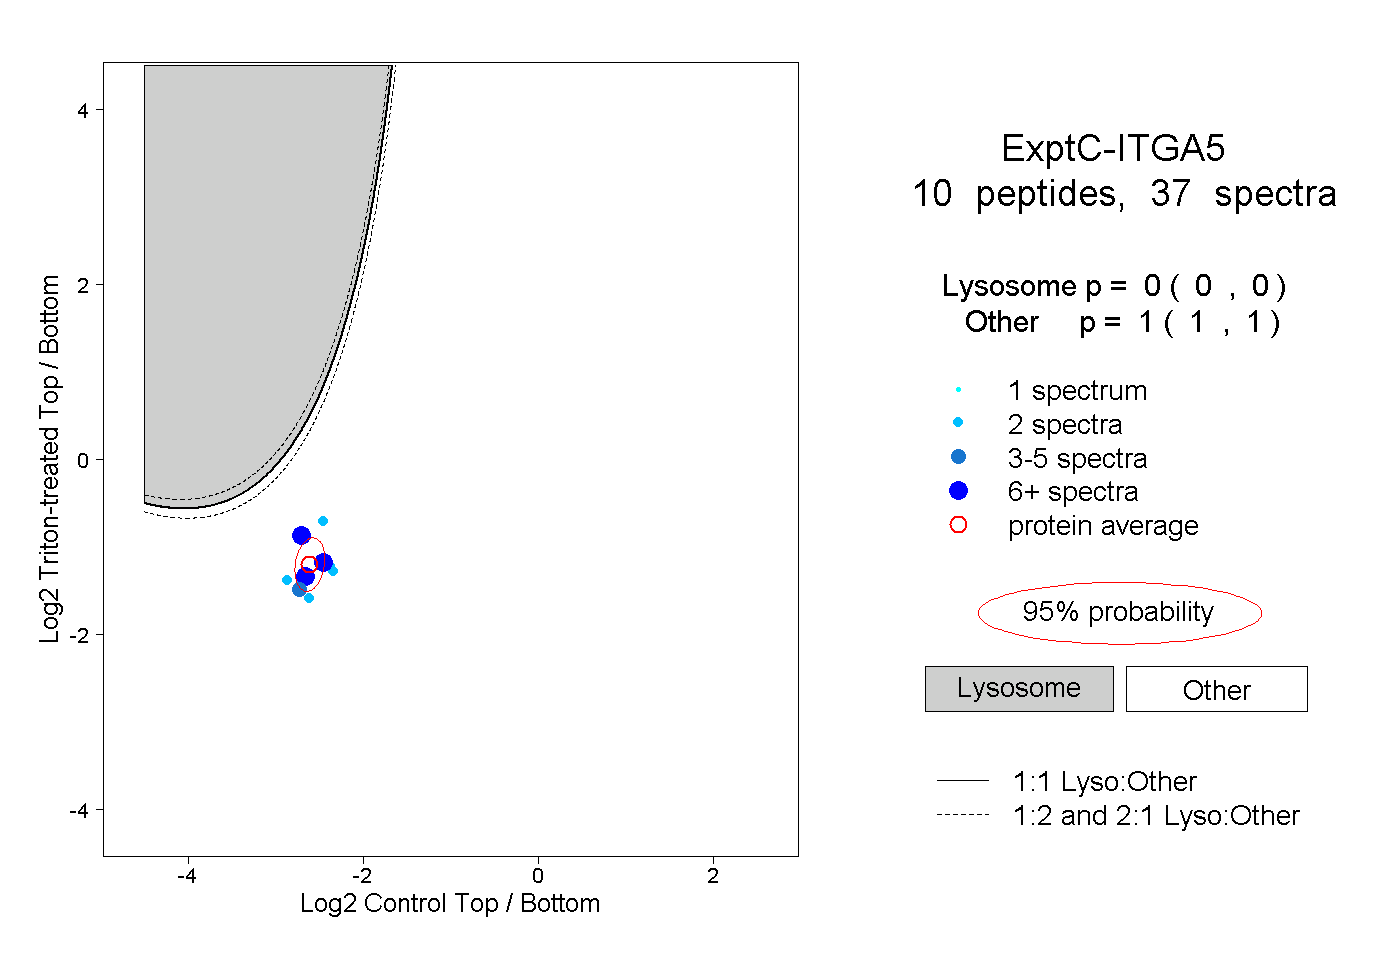 |
0.000 0.000 | 0.000 |
1.000 1.000 | 1.000 |
||||||||
| Plot | Lyso | Other | |||||||||||
| Expt D |
2 peptides |
2 spectra |
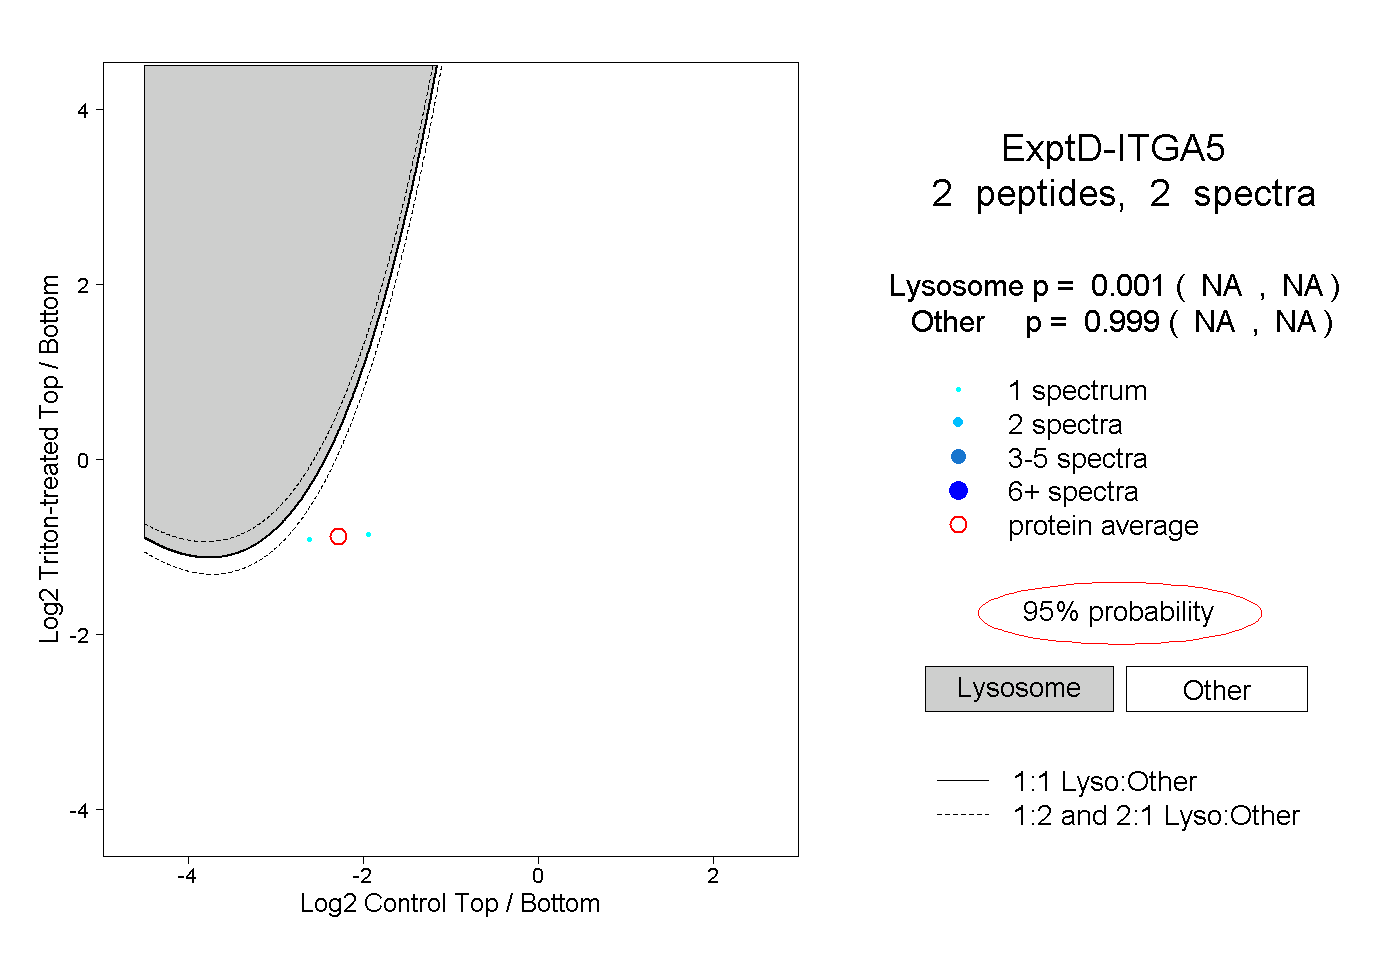 |
0.001 NA | NA |
0.999 NA | NA |