 7
7peptides
spectra
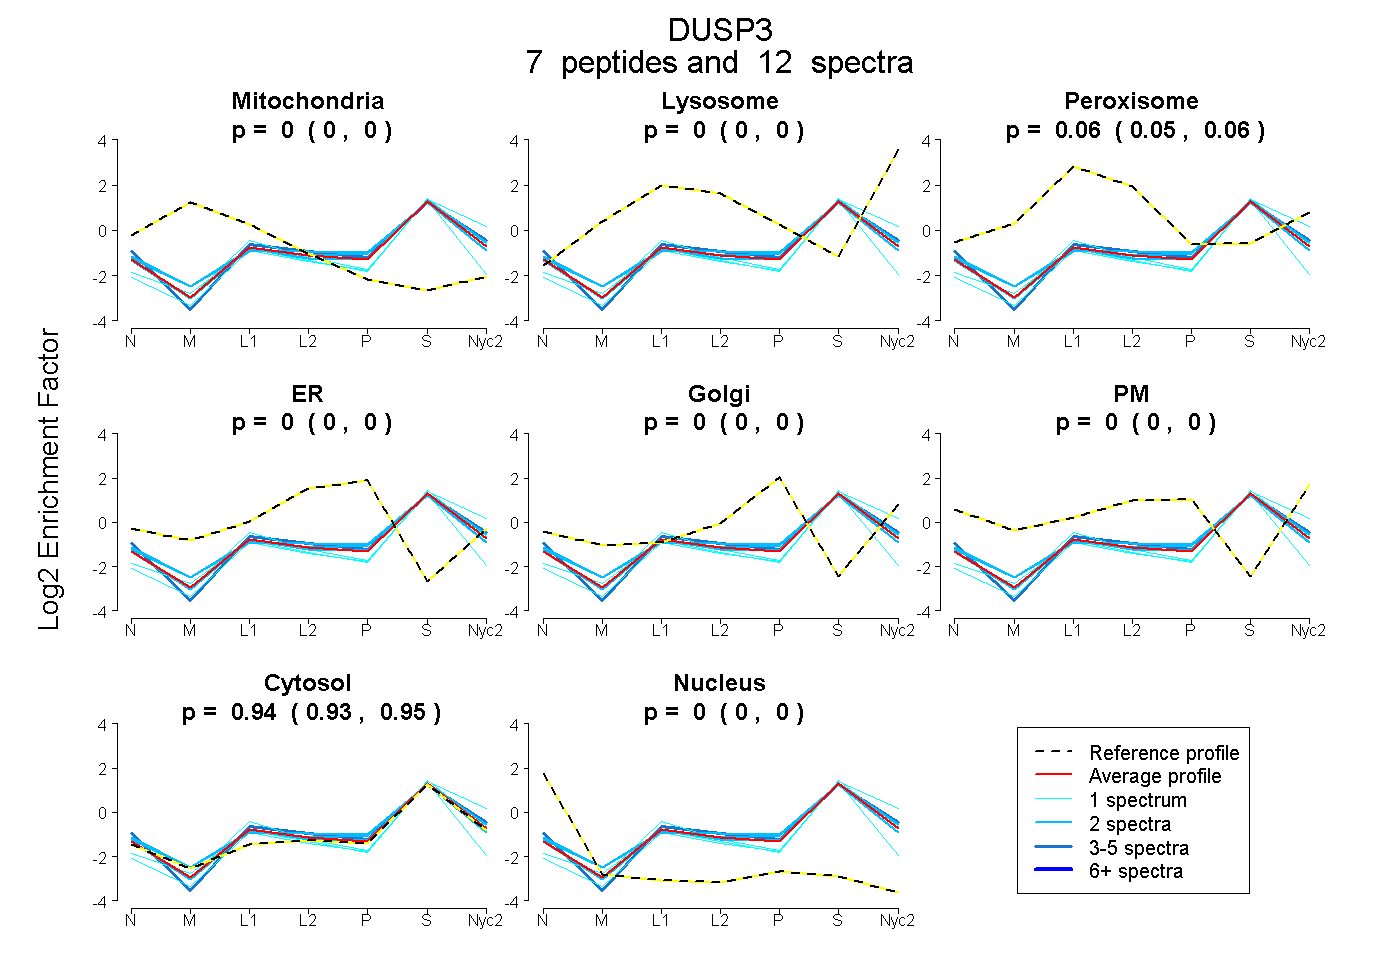
0.000 | 0.000
0.000 | 0.000
0.048 | 0.065
0.000 | 0.000
0.000 | 0.000
0.000 | 0.000
0.934 | 0.951
0.000 | 0.000
3peptides
spectra
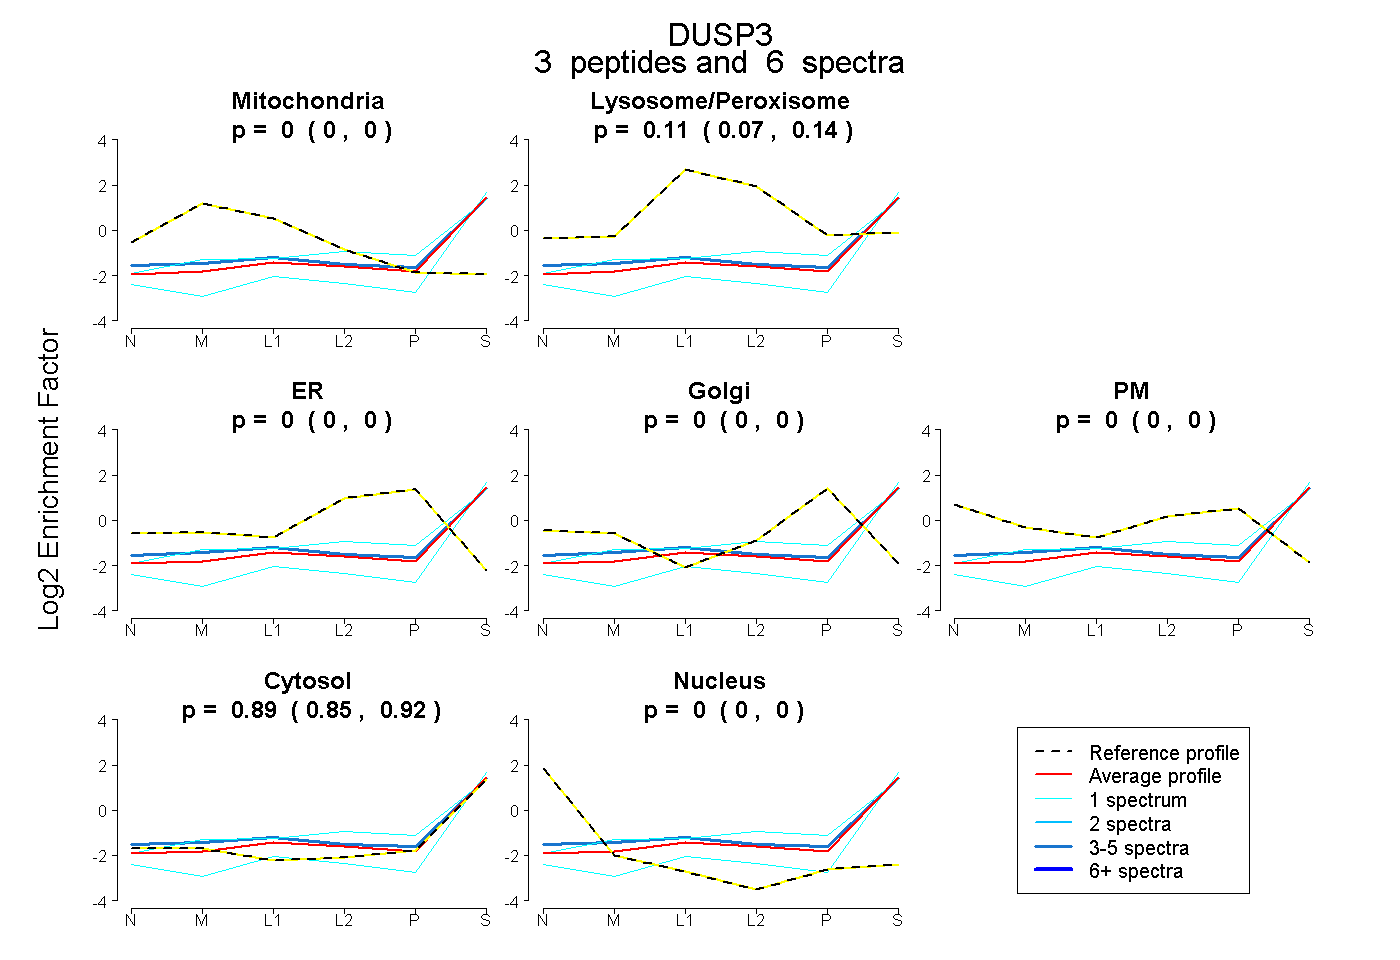
0.000 | 0.000
0.072 | 0.141
0.000 | 0.000
0.000 | 0.000
0.000 | 0.000
0.853 | 0.922
0.000 | 0.000
7peptides
spectra
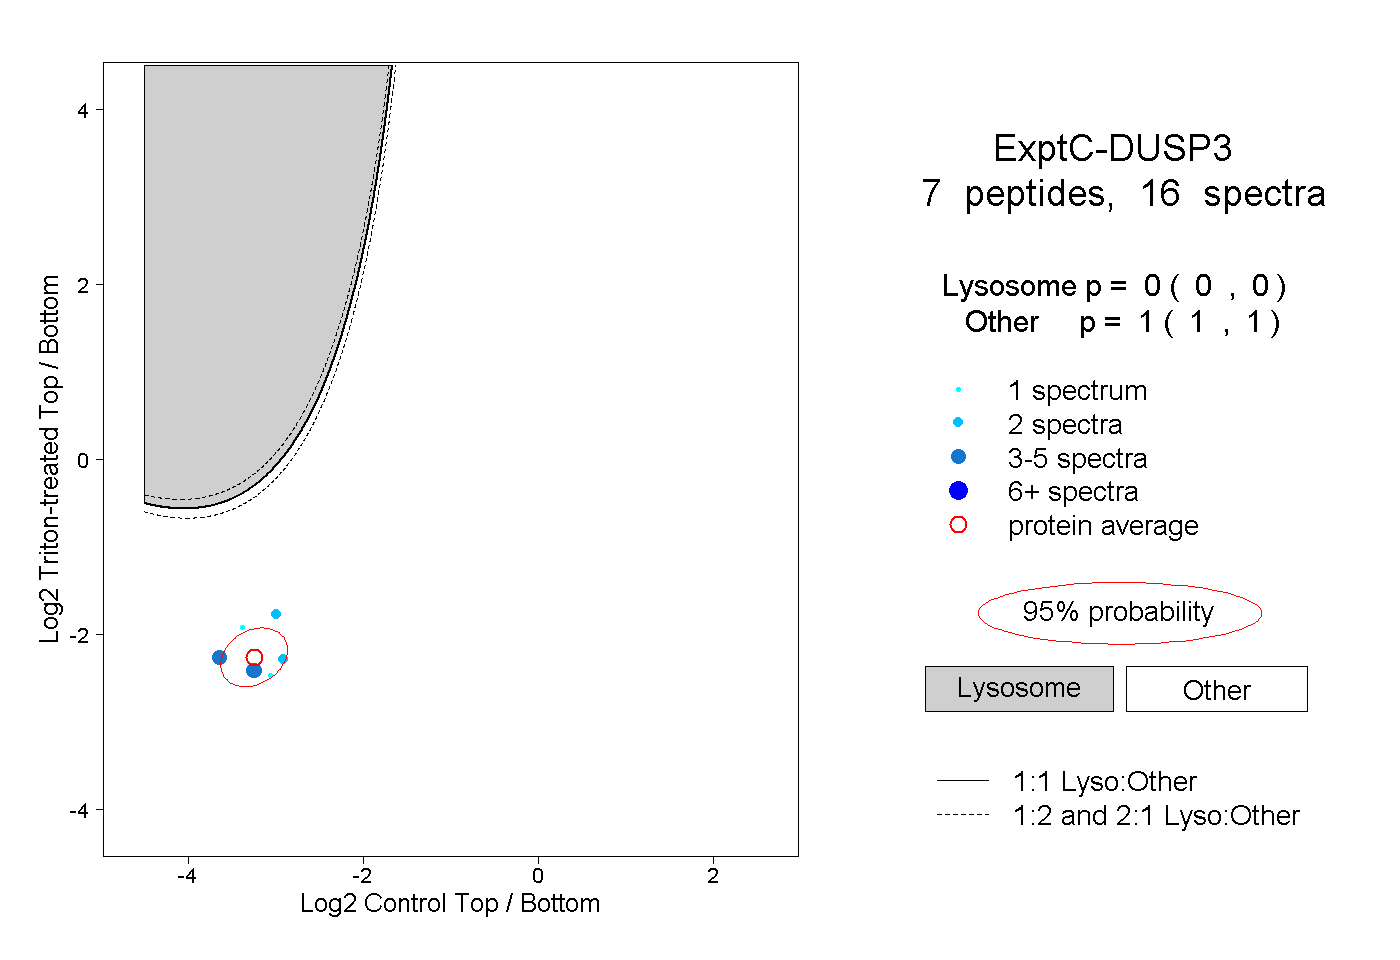
0.000 | 0.000
1.000 | 1.000
1peptide
spectra
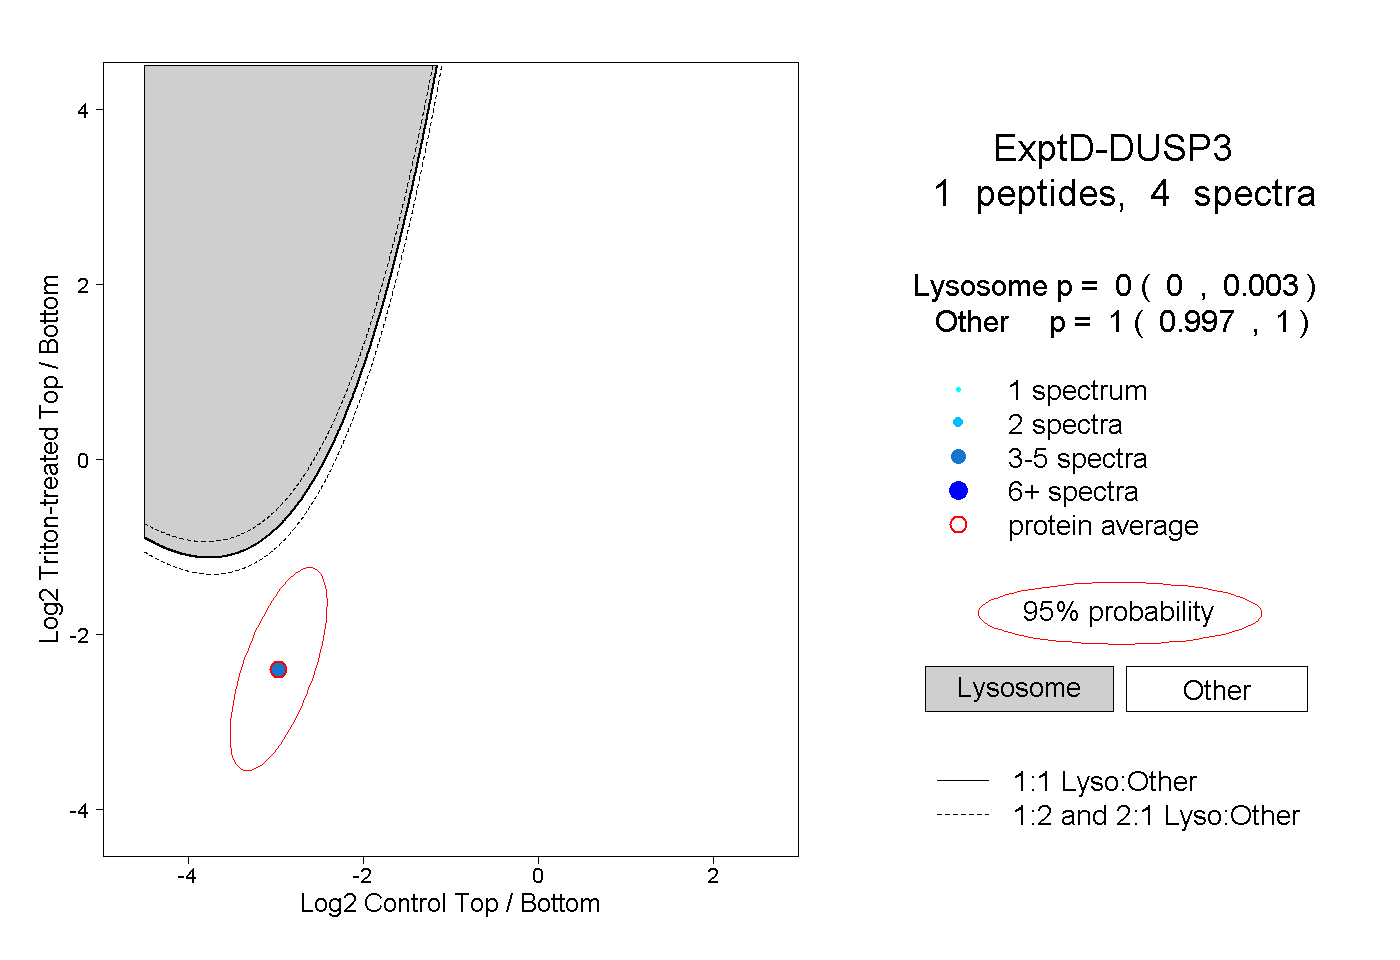
0.000 | 0.003
0.997 | 1.000