 7
7peptides
spectra
0.000 | 0.000
0.000 | 0.000
0.048 | 0.065
0.000 | 0.000
0.000 | 0.000
0.000 | 0.000
0.934 | 0.951
0.000 | 0.000
| Plot | Mito | Lyso | Perox | ER | Golgi | PM | Cytosol | Nucleus | |||||
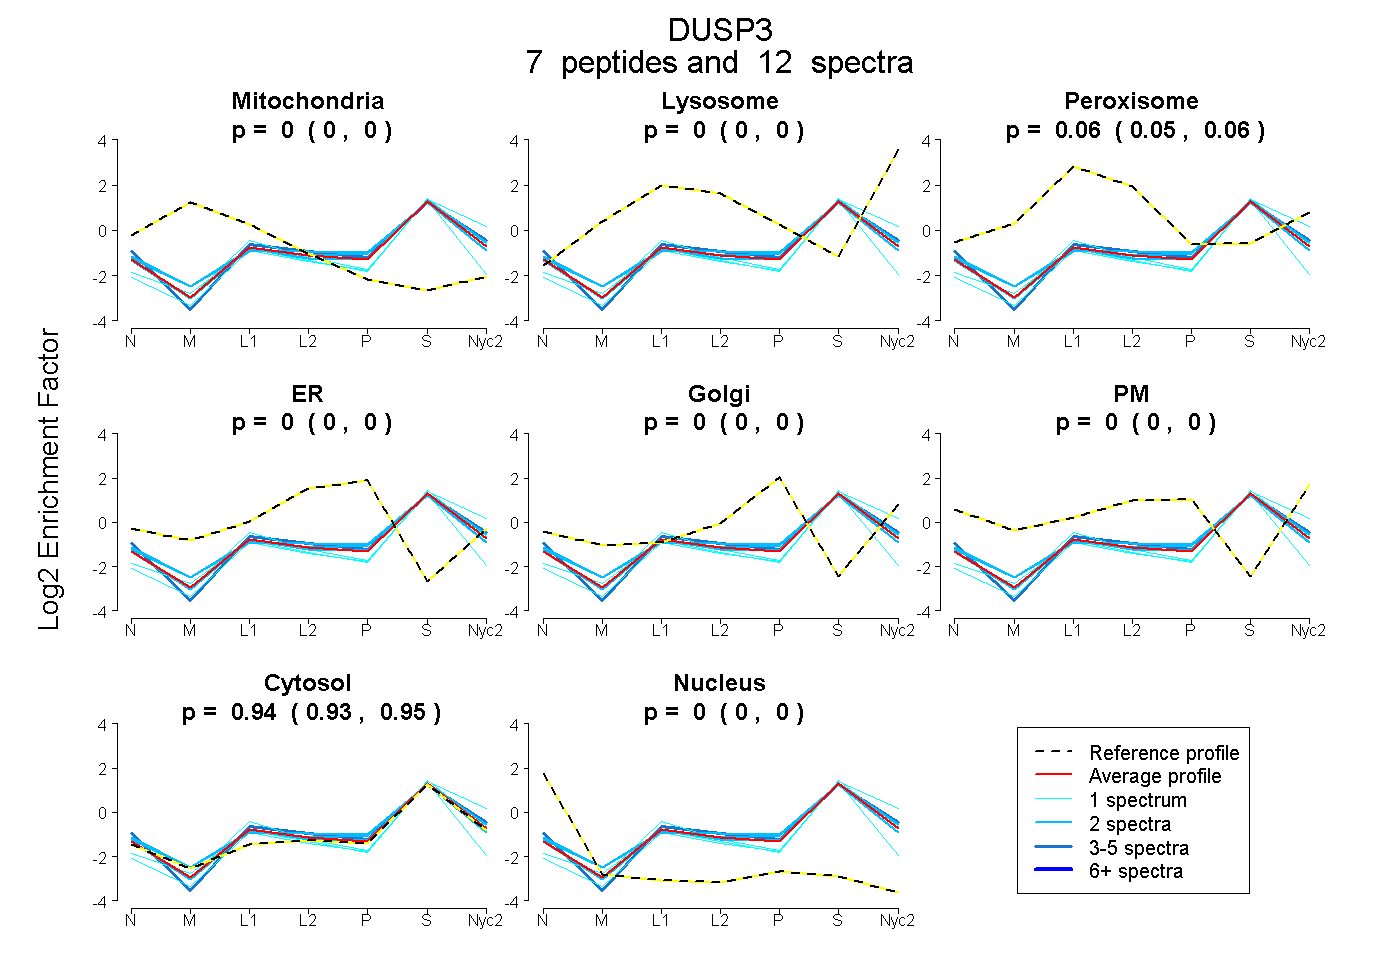
| Expt A |
7 peptides |
12 spectra |
|
0.000 0.000 | 0.000 |
0.000 0.000 | 0.000 |
0.057 0.048 | 0.065 |
0.000 0.000 | 0.000 |
0.000 0.000 | 0.000 |
0.000 0.000 | 0.000 |
0.943 0.934 | 0.951 |
0.000 0.000 | 0.000 |
| 1 spectrum, ANDTQEFNLSAYFER | 0.000 | 0.000 | 0.000 | 0.000 | 0.000 | 0.000 | 1.000 | 0.000 | ||
| 2 spectra, LGITHVLNAAEGR | 0.000 | 0.007 | 0.041 | 0.000 | 0.000 | 0.000 | 0.953 | 0.000 | ||
| 1 spectrum, DTGITYMGIK | 0.000 | 0.084 | 0.000 | 0.000 | 0.000 | 0.000 | 0.916 | 0.000 | ||
| 2 spectra, SALSTVR | 0.000 | 0.000 | 0.072 | 0.014 | 0.000 | 0.000 | 0.914 | 0.000 | ||
| 1 spectrum, EIGPNDGFLAQLCQLNDR | 0.000 | 0.000 | 0.039 | 0.000 | 0.000 | 0.000 | 0.908 | 0.054 | ||
| 3 spectra, AADFIDQALAHK | 0.000 | 0.000 | 0.065 | 0.000 | 0.000 | 0.003 | 0.932 | 0.000 | ||
| 2 spectra, VLVHCR | 0.000 | 0.000 | 0.065 | 0.032 | 0.000 | 0.000 | 0.903 | 0.000 |
| Plot | Mito | Lyso or Perox | ER | Golgi | PM | Cytosol | Nucleus | ||||||
| Expt B |
3 peptides |
6 spectra |
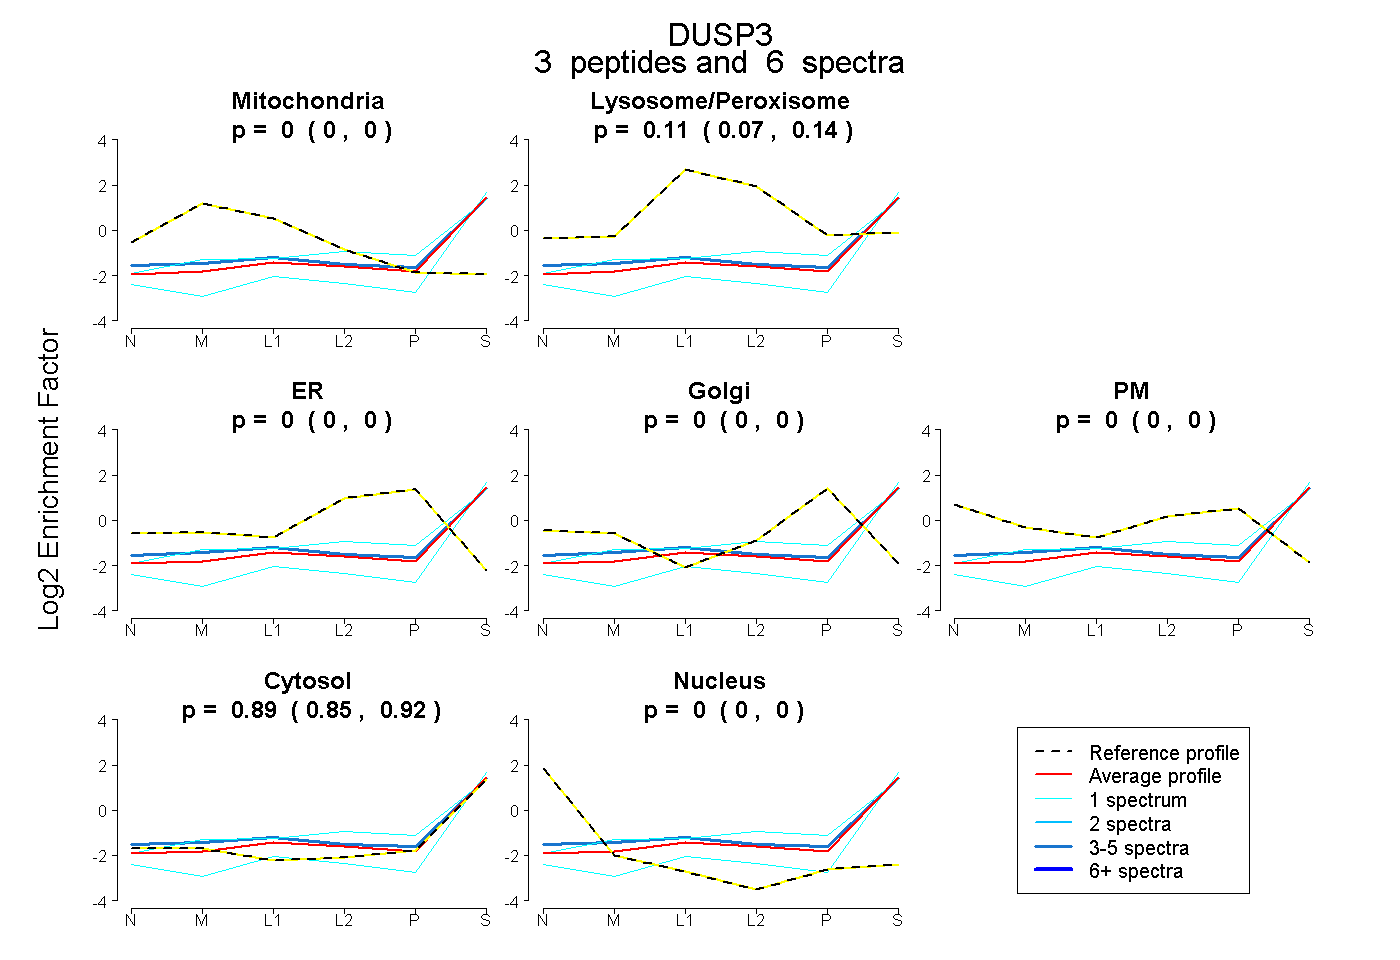 |
0.000 0.000 | 0.000 |
0.109 0.072 | 0.141 |
0.000 0.000 | 0.000 |
0.000 0.000 | 0.000 |
0.000 0.000 | 0.000 |
0.891 0.853 | 0.922 |
0.000 0.000 | 0.000 |
|||
| Plot | Lyso | Other | |||||||||||
| Expt C |
7 peptides |
16 spectra |
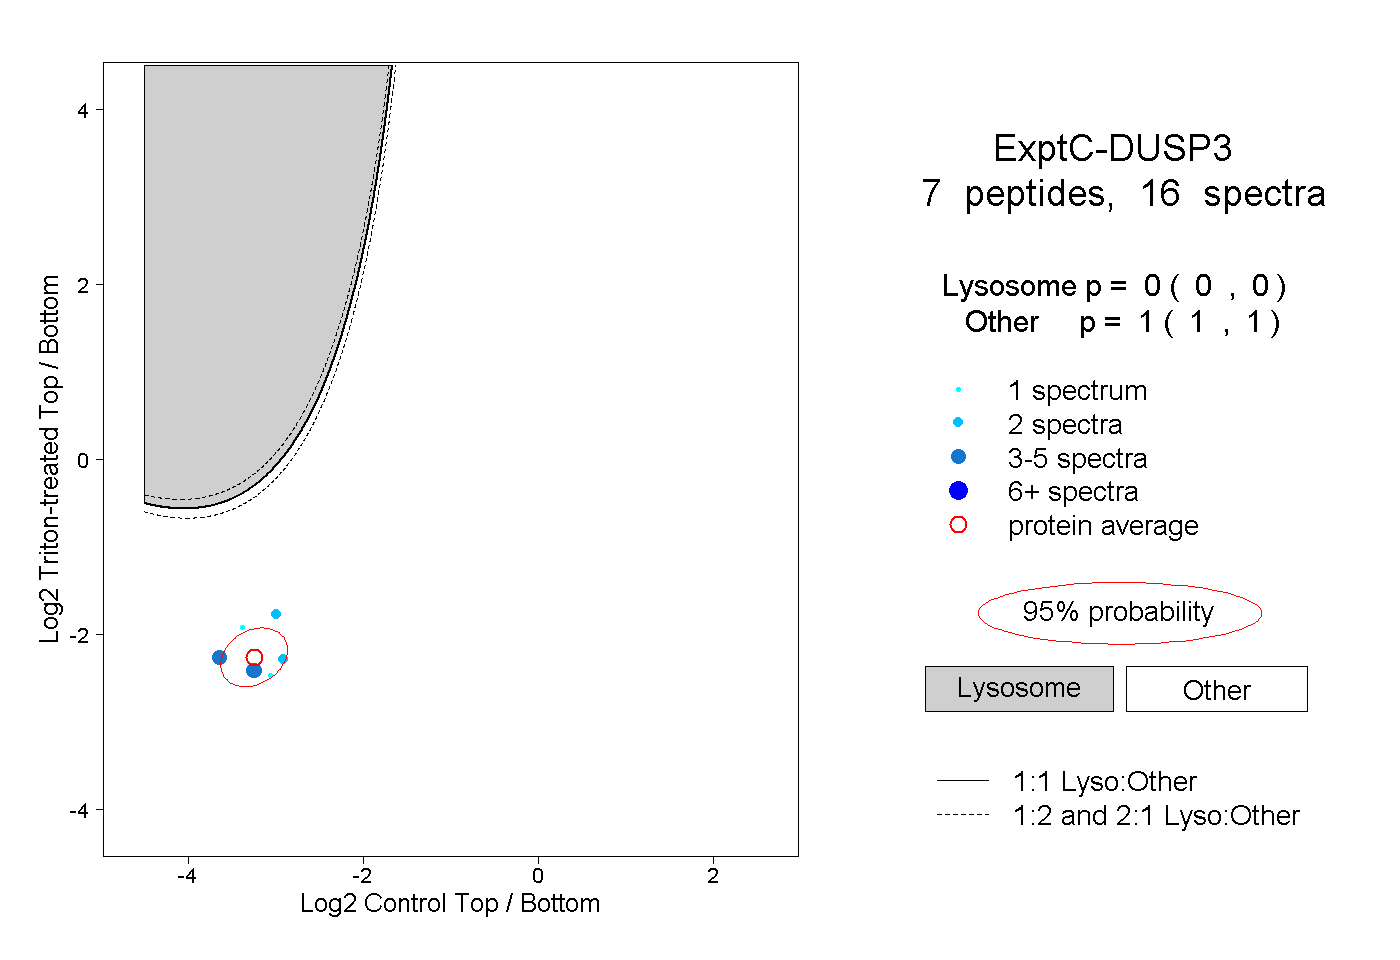 |
0.000 0.000 | 0.000 |
1.000 1.000 | 1.000 |
||||||||
| Plot | Lyso | Other | |||||||||||
| Expt D |
1 peptide |
4 spectra |
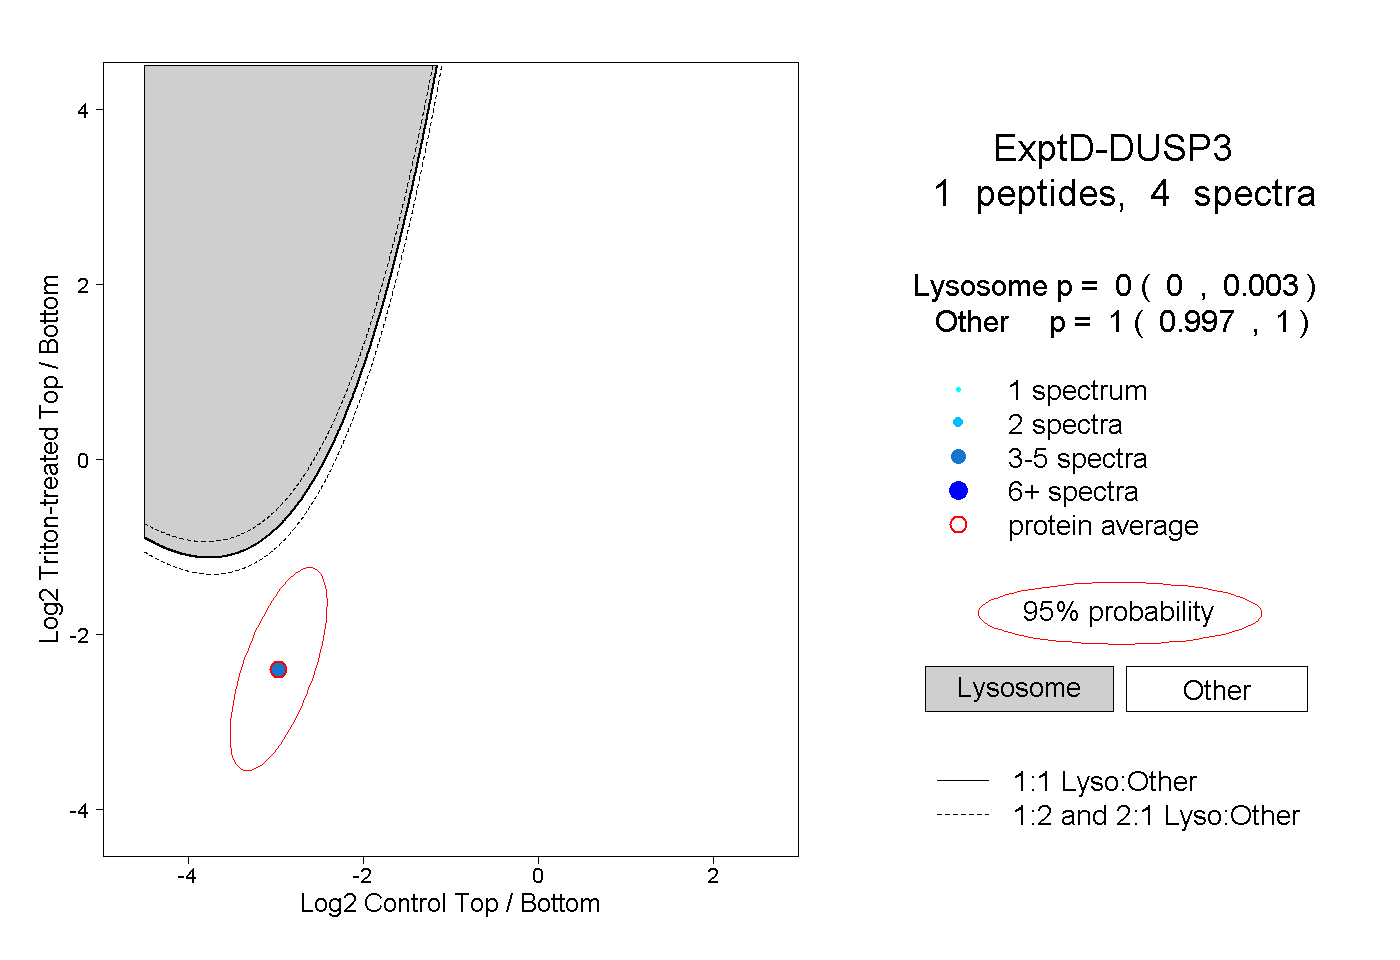 |
0.000 0.000 | 0.003 |
1.000 0.997 | 1.000 |