 5
5peptides
spectra
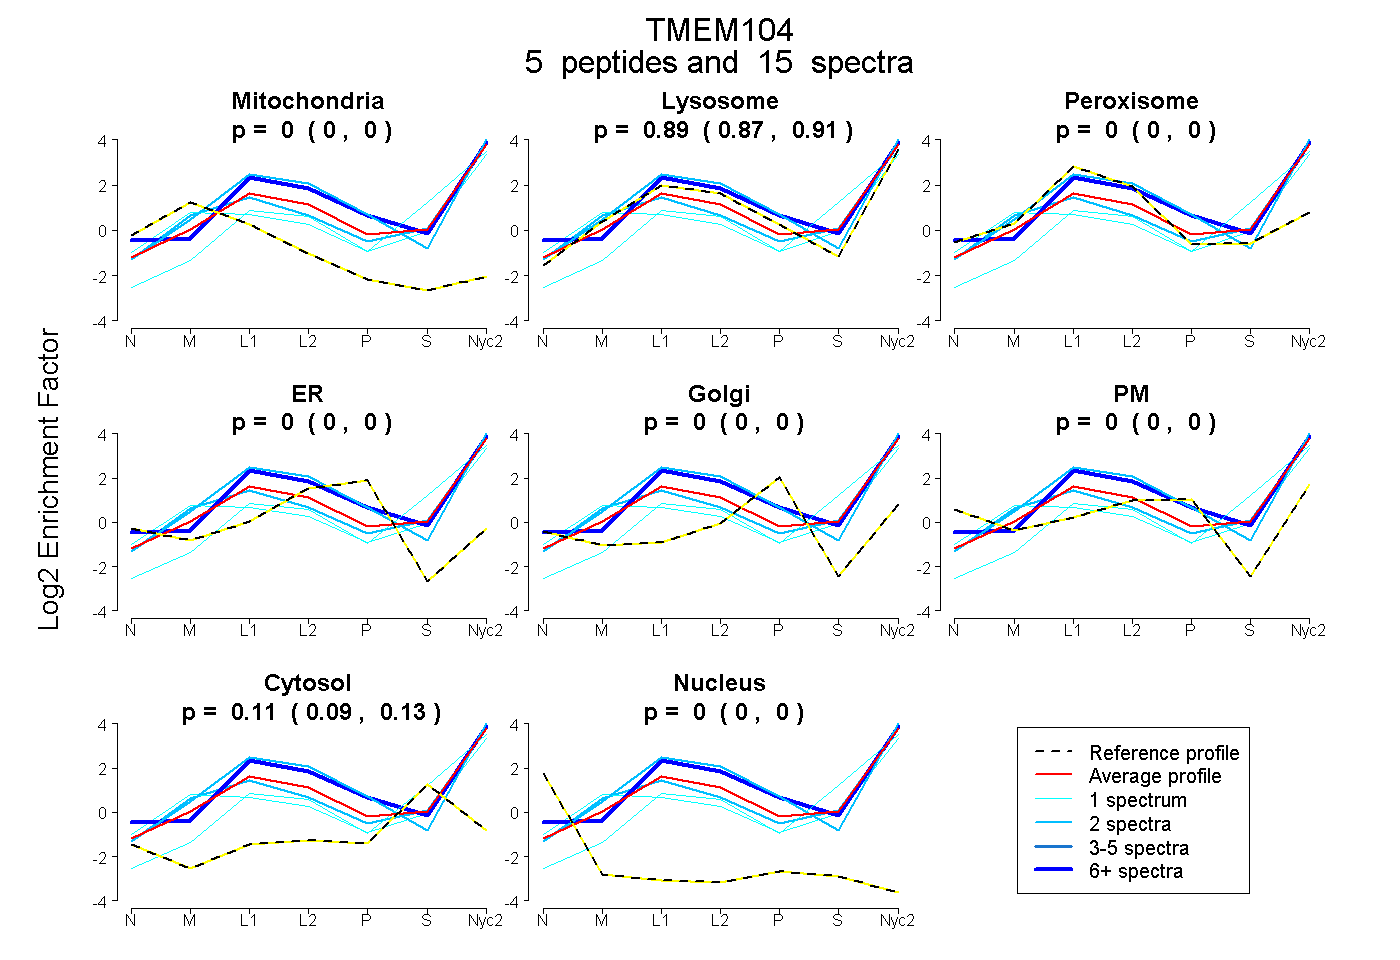
0.000 | 0.000
0.869 | 0.906
0.000 | 0.000
0.000 | 0.000
0.000 | 0.000
0.000 | 0.000
0.091 | 0.127
0.000 | 0.000
1peptide
spectrum
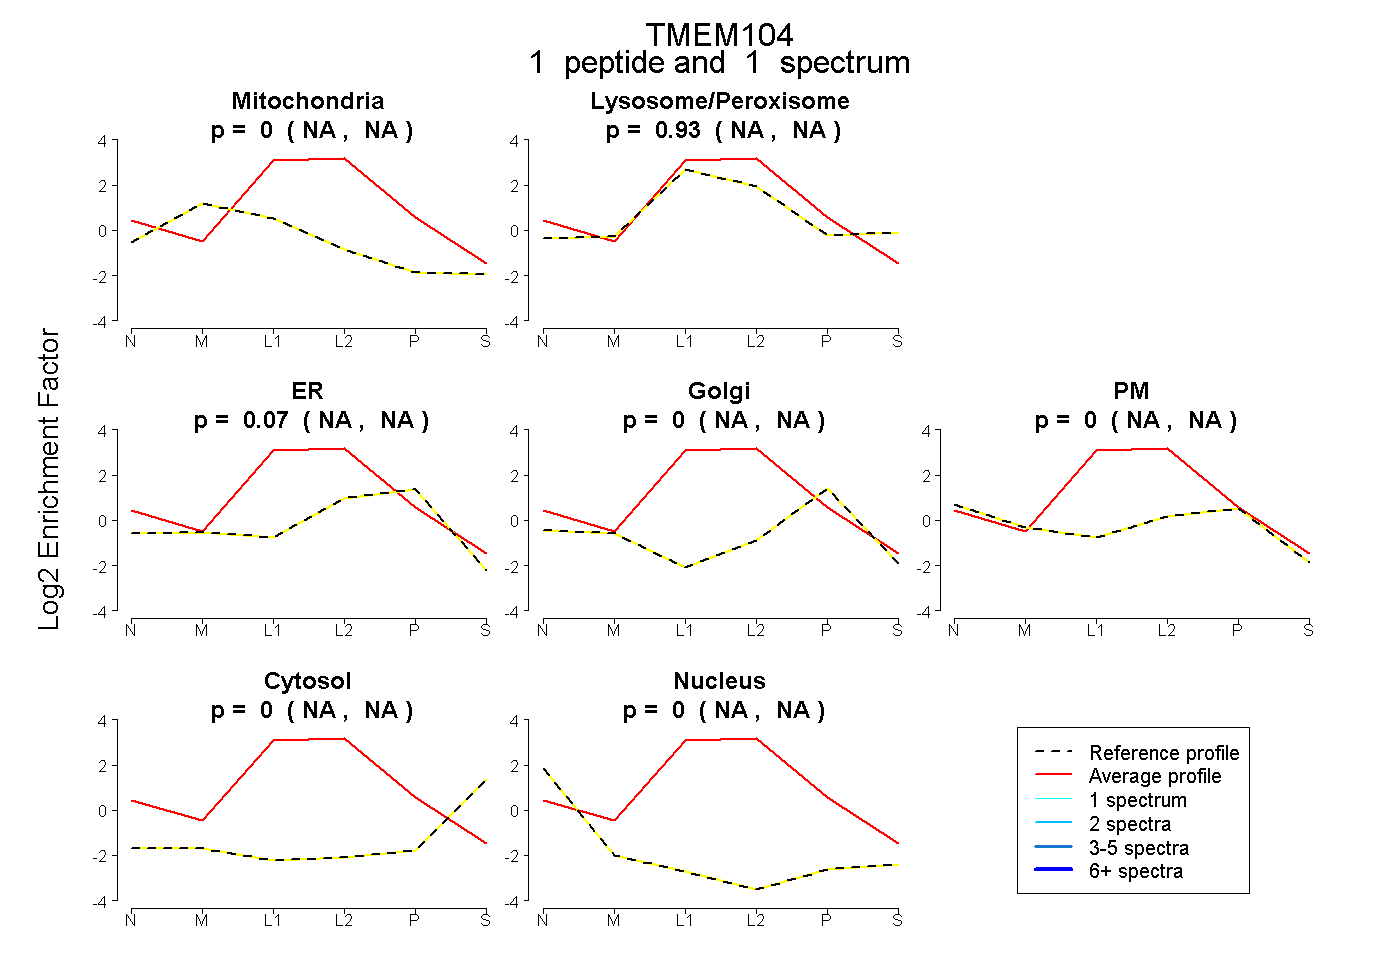
NA | NA
NA | NA
NA | NA
NA | NA
NA | NA
NA | NA
NA | NA
6peptides
spectra
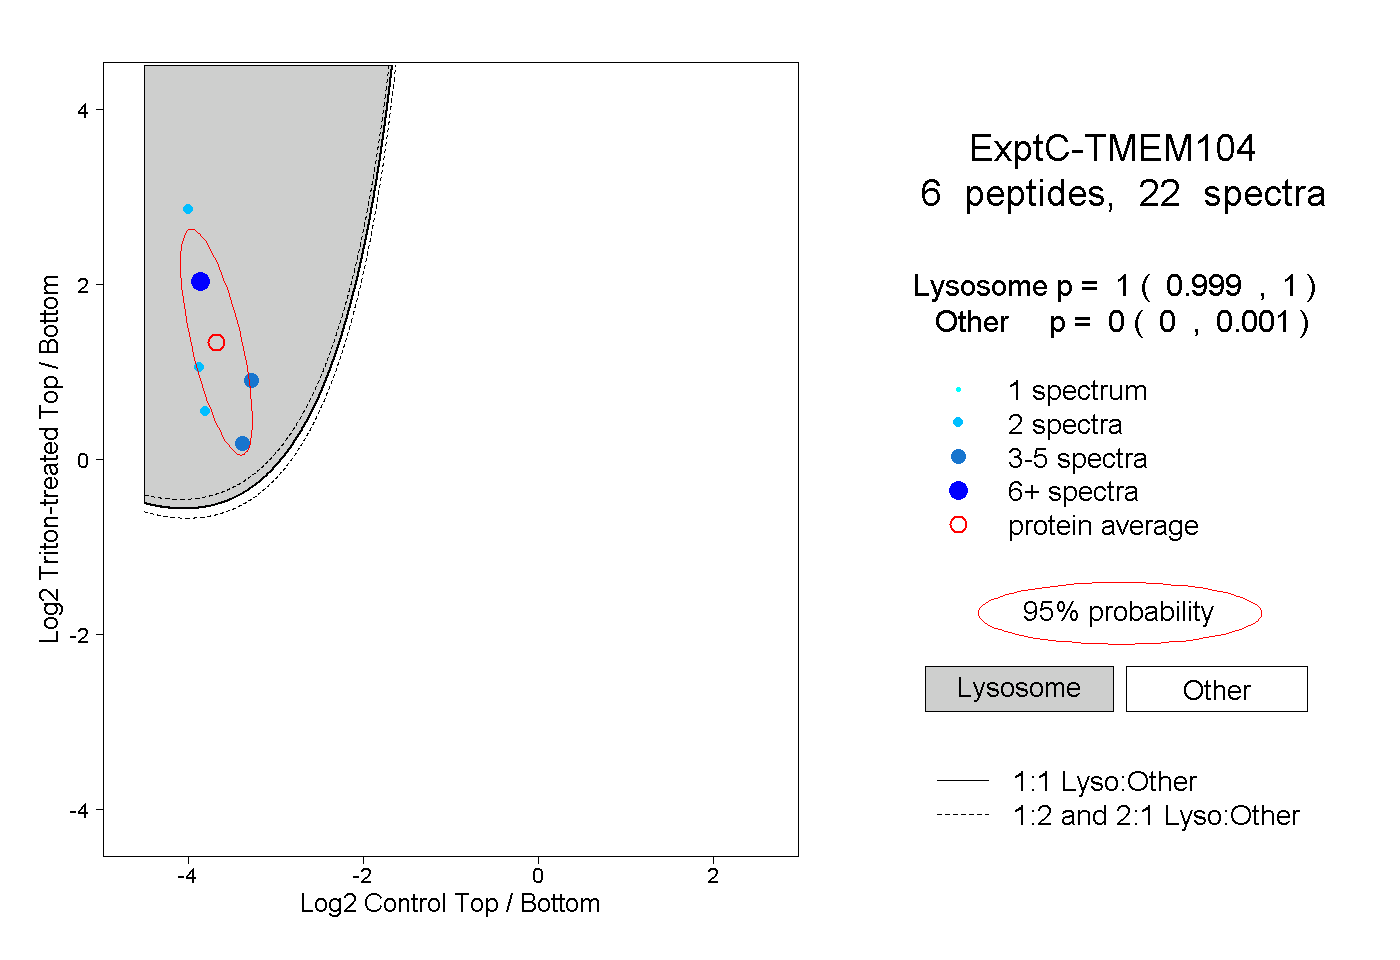
0.999 | 1.000
0.000 | 0.001
2peptides
spectra
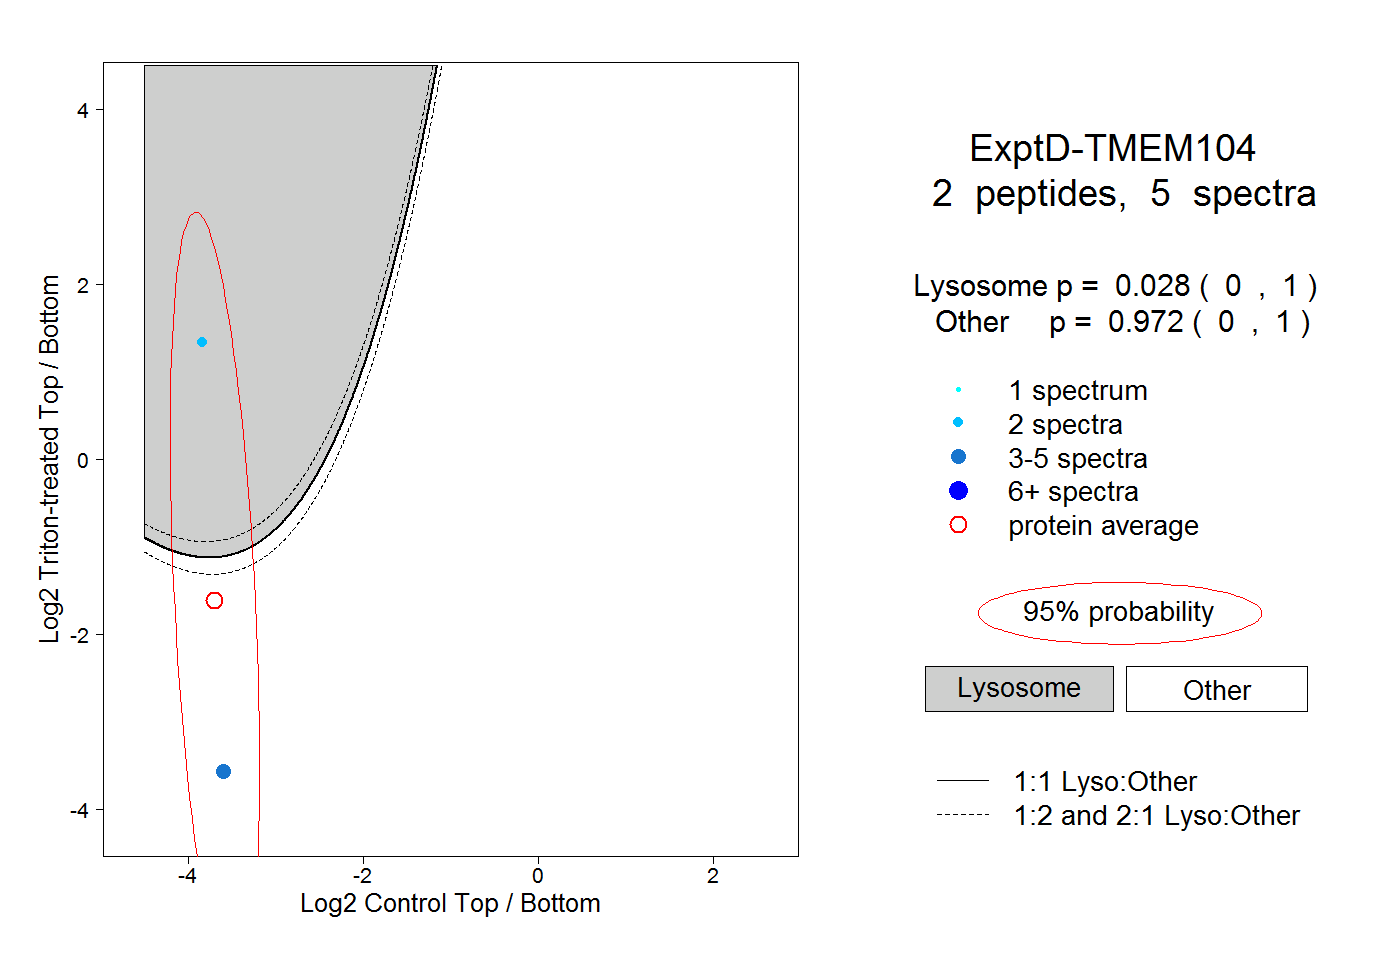
0.000 | 1.000
0.000 | 1.000