 5
5peptides
spectra
0.000 | 0.000
0.869 | 0.906
0.000 | 0.000
0.000 | 0.000
0.000 | 0.000
0.000 | 0.000
0.091 | 0.127
0.000 | 0.000
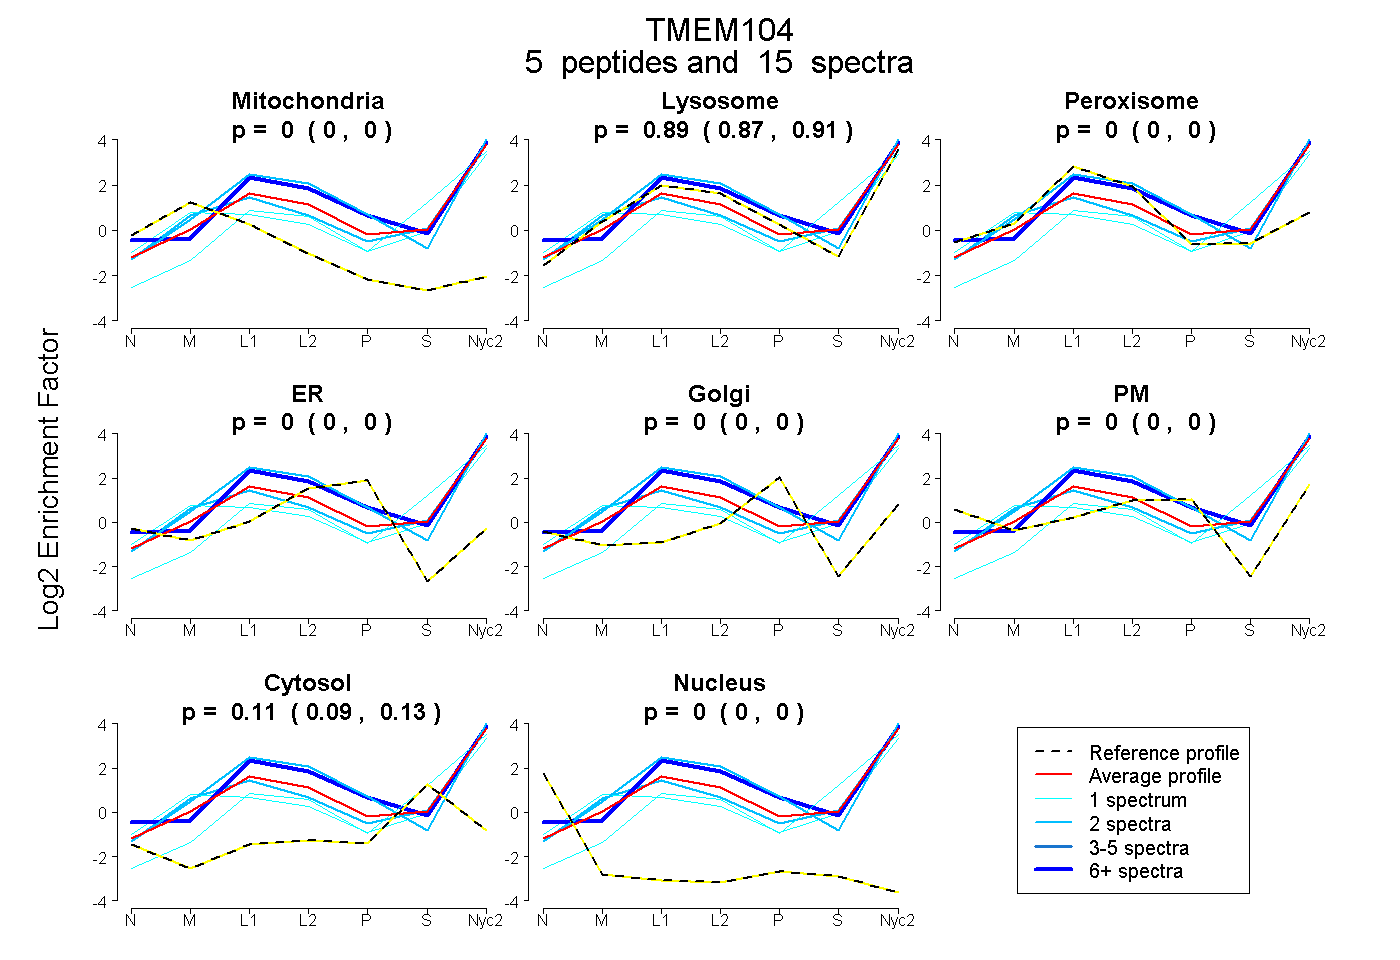
| Plot | Mito | Lyso | Perox | ER | Golgi | PM | Cytosol | Nucleus | |||||
| Expt A |
5 peptides |
15 spectra |
|
0.000 0.000 | 0.000 |
0.889 0.869 | 0.906 |
0.000 0.000 | 0.000 |
0.000 0.000 | 0.000 |
0.000 0.000 | 0.000 |
0.000 0.000 | 0.000 |
0.111 0.091 | 0.127 |
0.000 0.000 | 0.000 |
| 1 spectrum, YNDTDLCWGPLR | 0.000 | 0.650 | 0.000 | 0.000 | 0.000 | 0.000 | 0.350 | 0.000 | ||
| 2 spectra, SSASLFEITER | 0.000 | 1.000 | 0.000 | 0.000 | 0.000 | 0.000 | 0.000 | 0.000 | ||
| 9 spectra, RPILSVQR | 0.000 | 0.915 | 0.076 | 0.000 | 0.000 | 0.009 | 0.000 | 0.000 | ||
| 1 spectrum, GDSLMDMYTLNFAR | 0.041 | 0.758 | 0.000 | 0.000 | 0.000 | 0.000 | 0.201 | 0.000 | ||
| 2 spectra, EGGTYPWVVDR | 0.000 | 0.872 | 0.000 | 0.000 | 0.000 | 0.000 | 0.128 | 0.000 |
| Plot | Mito | Lyso or Perox | ER | Golgi | PM | Cytosol | Nucleus | ||||||
| Expt B |
1 peptide |
1 spectrum |
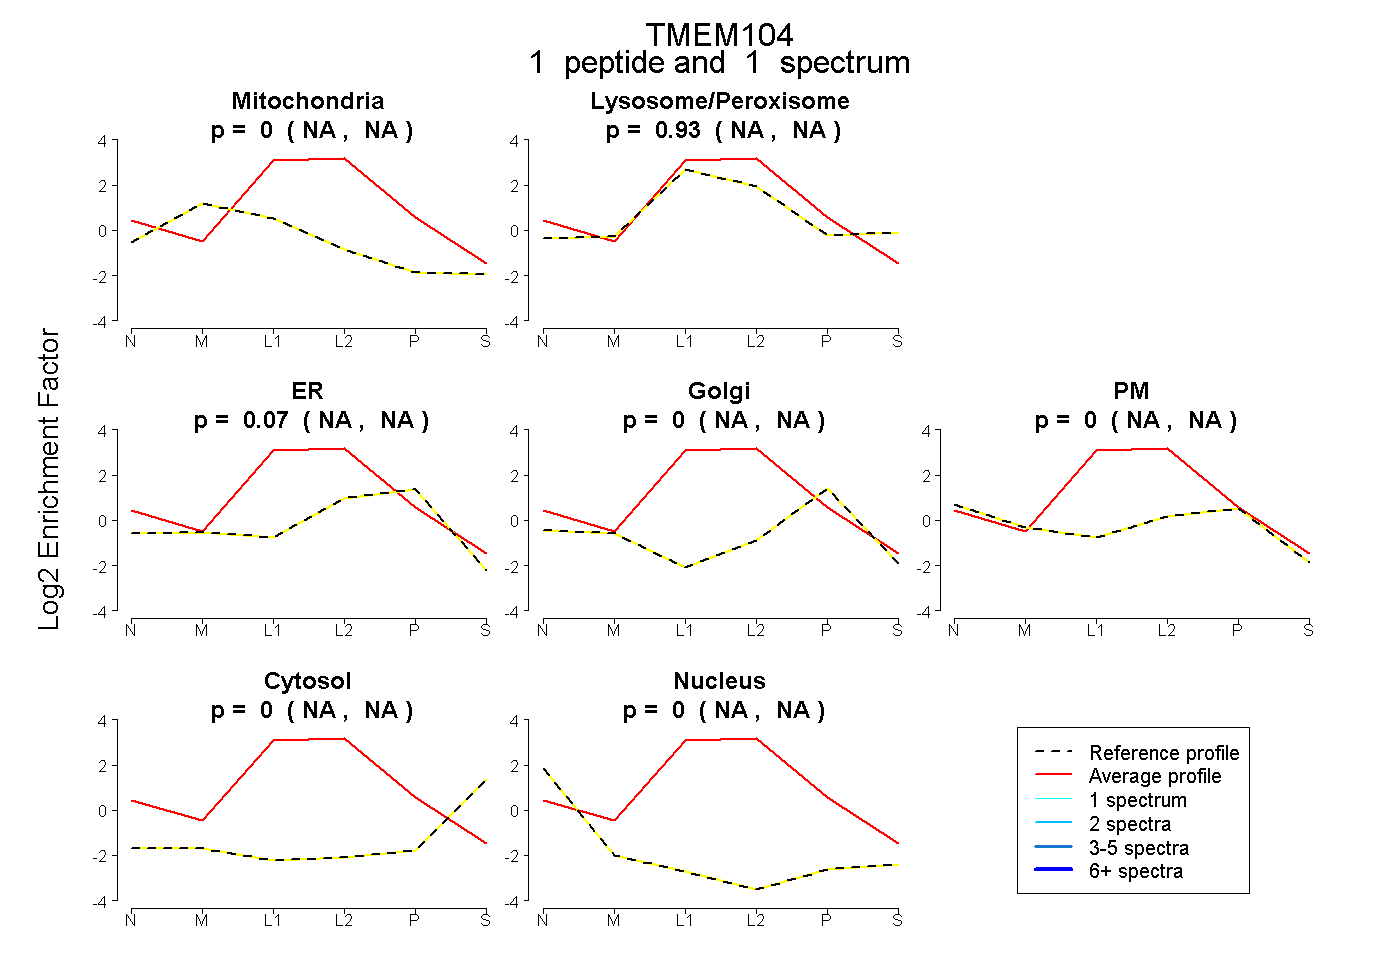 |
0.000 NA | NA |
0.927 NA | NA |
0.073 NA | NA |
0.000 NA | NA |
0.000 NA | NA |
0.000 NA | NA |
0.000 NA | NA |
|||
| Plot | Lyso | Other | |||||||||||
| Expt C |
6 peptides |
22 spectra |
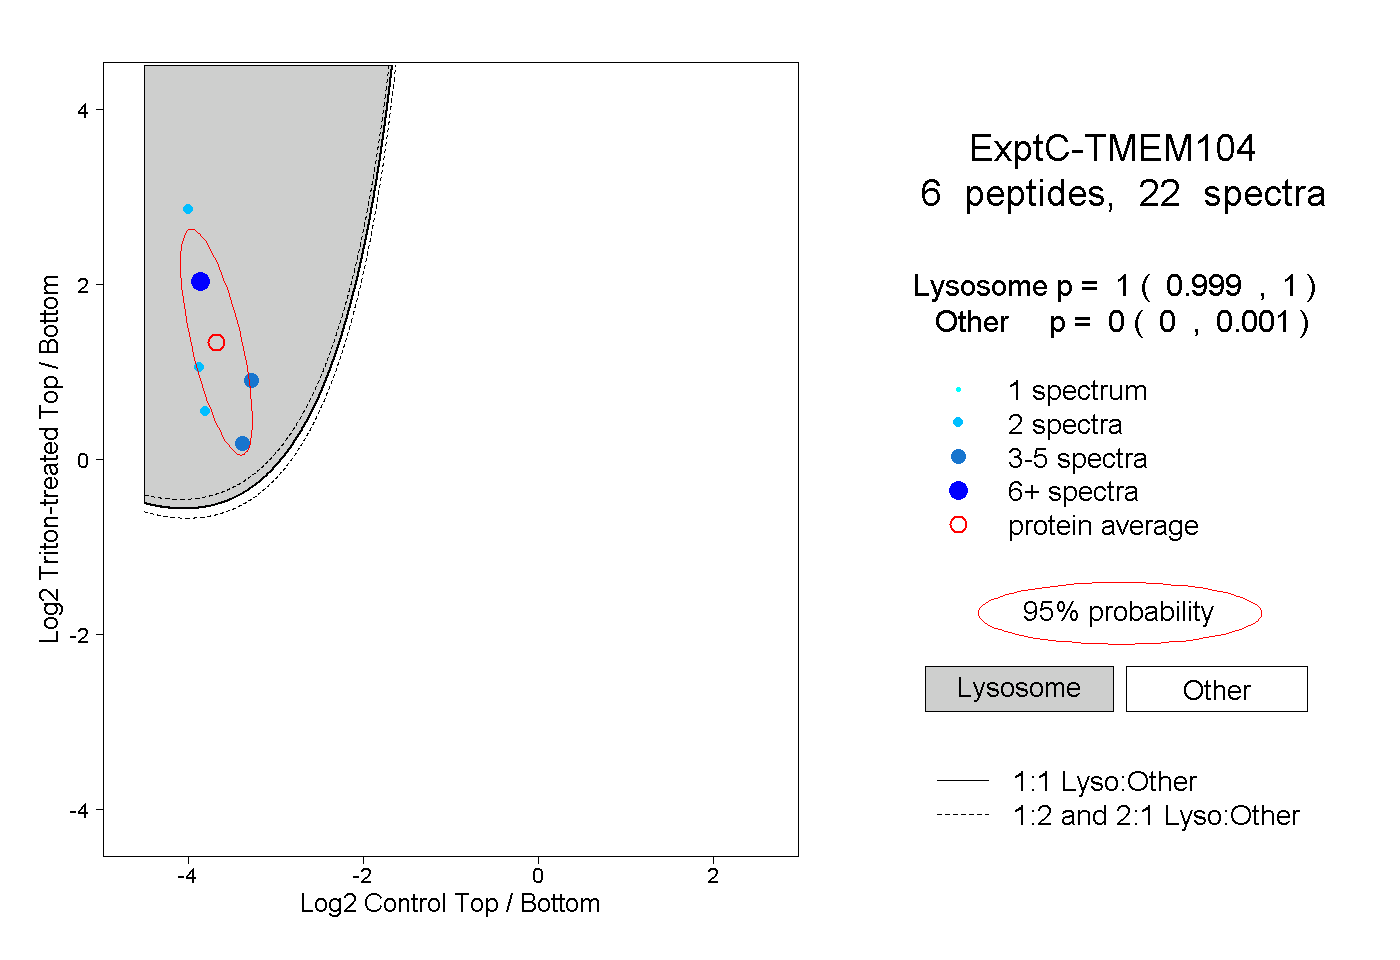 |
1.000 0.999 | 1.000 |
0.000 0.000 | 0.001 |
||||||||
| Plot | Lyso | Other | |||||||||||
| Expt D |
2 peptides |
5 spectra |
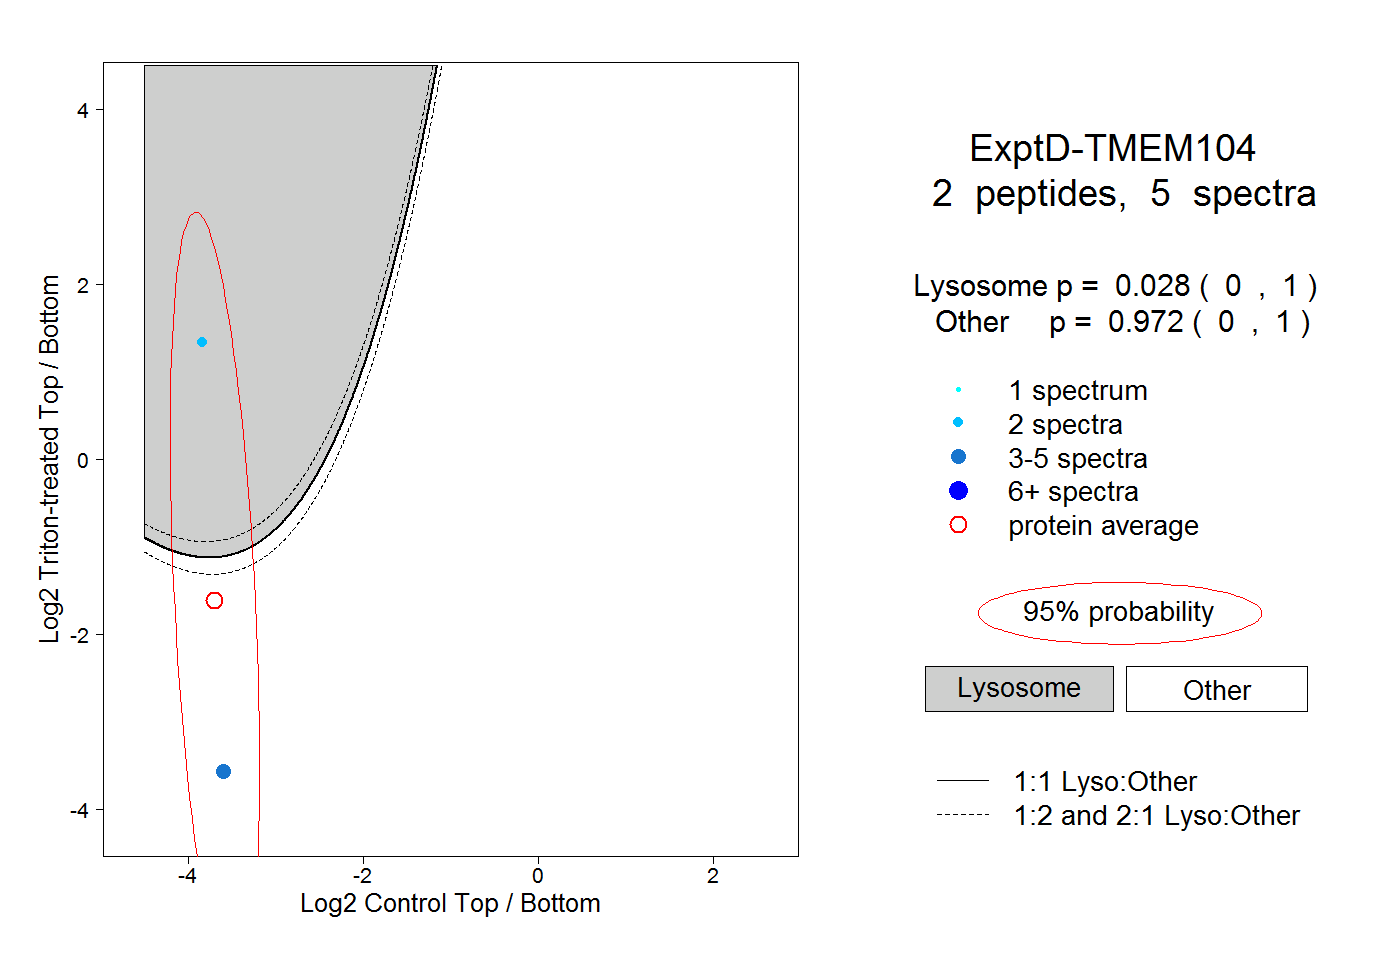 |
0.028 0.000 | 1.000 |
0.972 0.000 | 1.000 |