 6
6peptides
spectra
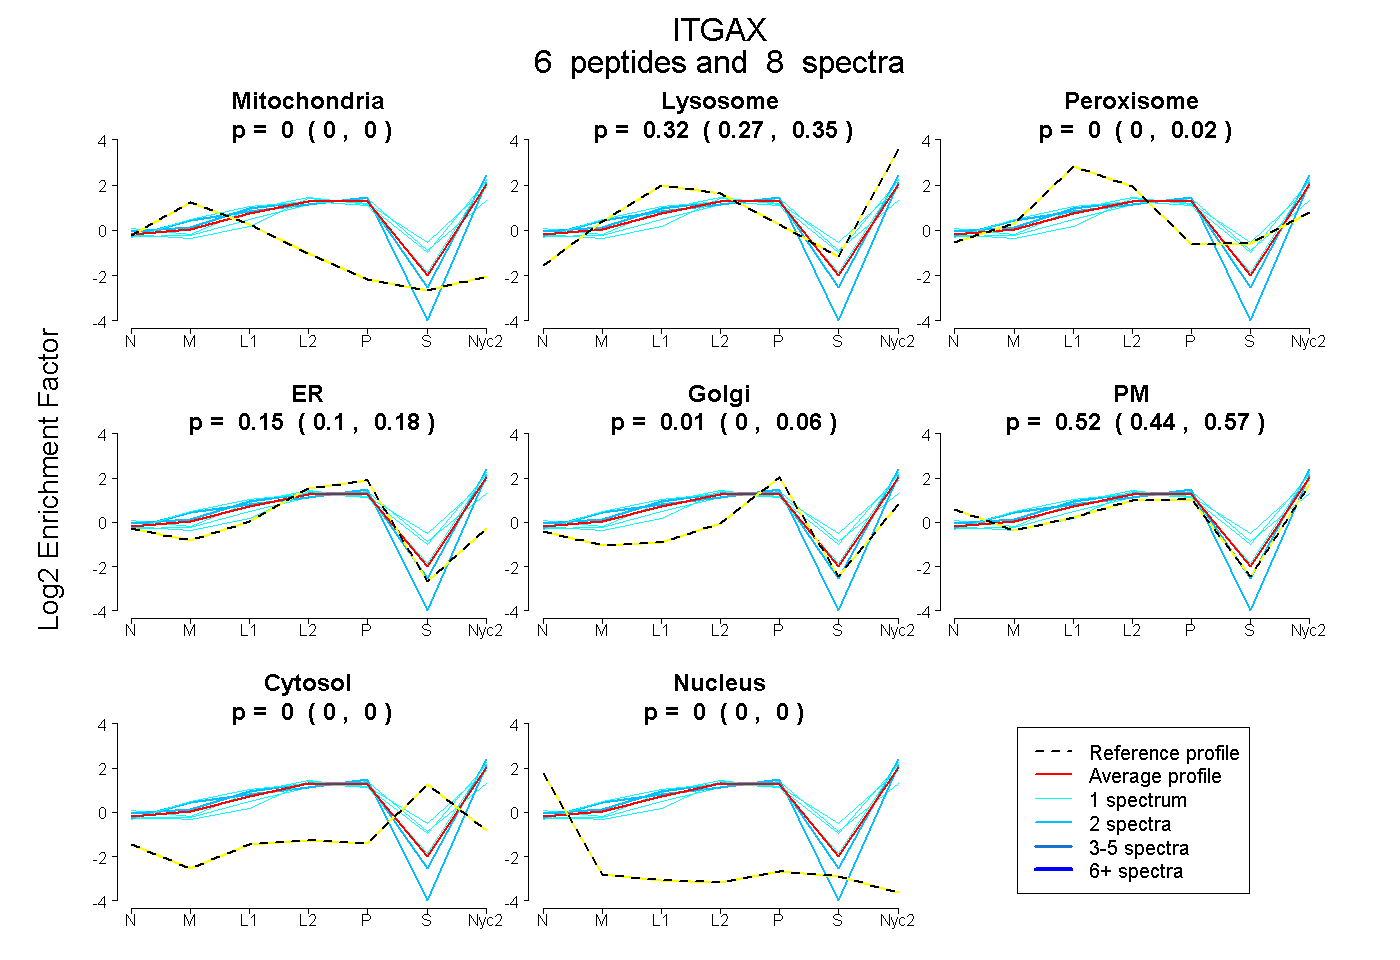
0.000 | 0.000
0.269 | 0.350
0.000 | 0.016
0.100 | 0.181
0.000 | 0.063
0.435 | 0.574
0.000 | 0.000
0.000 | 0.000
5peptides
spectra
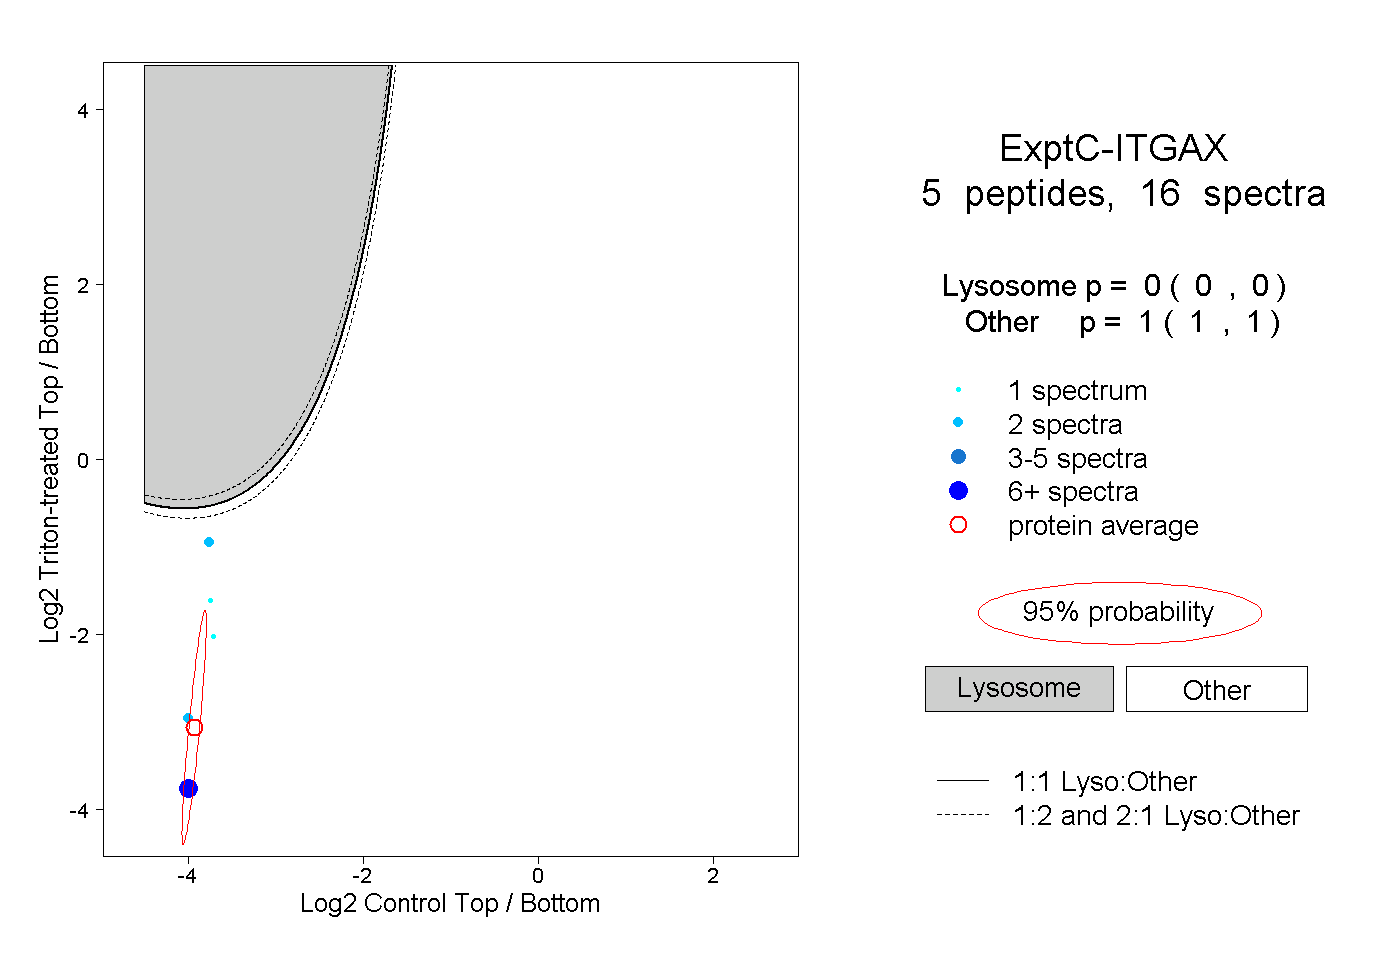
0.000 | 0.000
1.000 | 1.000
1peptide
spectrum
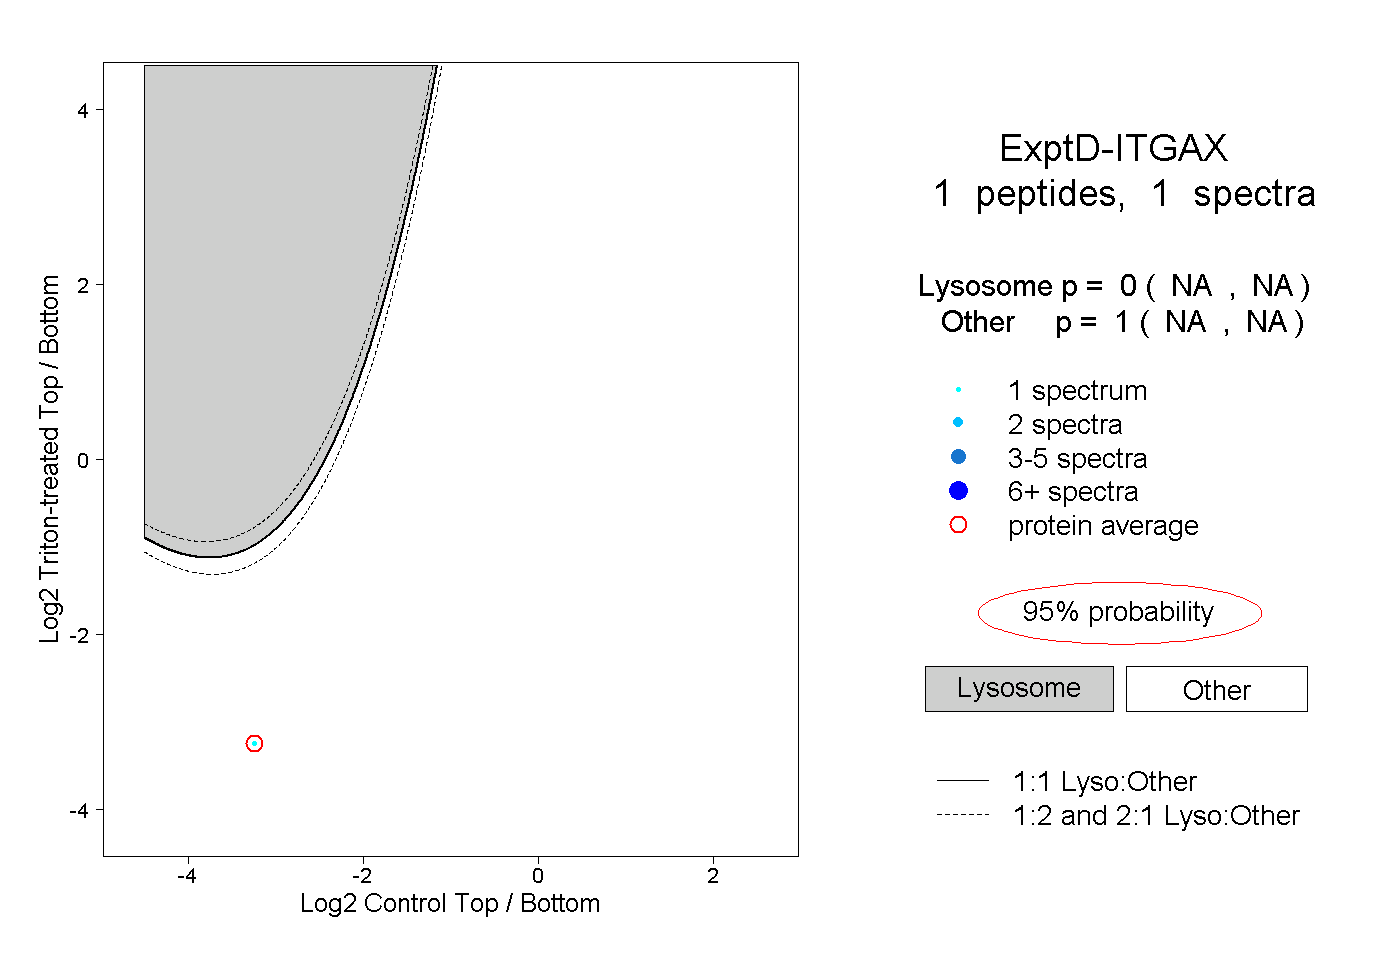
NA | NA
NA | NA