 6
6peptides
spectra
0.000 | 0.000
0.269 | 0.350
0.000 | 0.016
0.100 | 0.181
0.000 | 0.063
0.435 | 0.574
0.000 | 0.000
0.000 | 0.000
| Plot | Mito | Lyso | Perox | ER | Golgi | PM | Cytosol | Nucleus | |||||
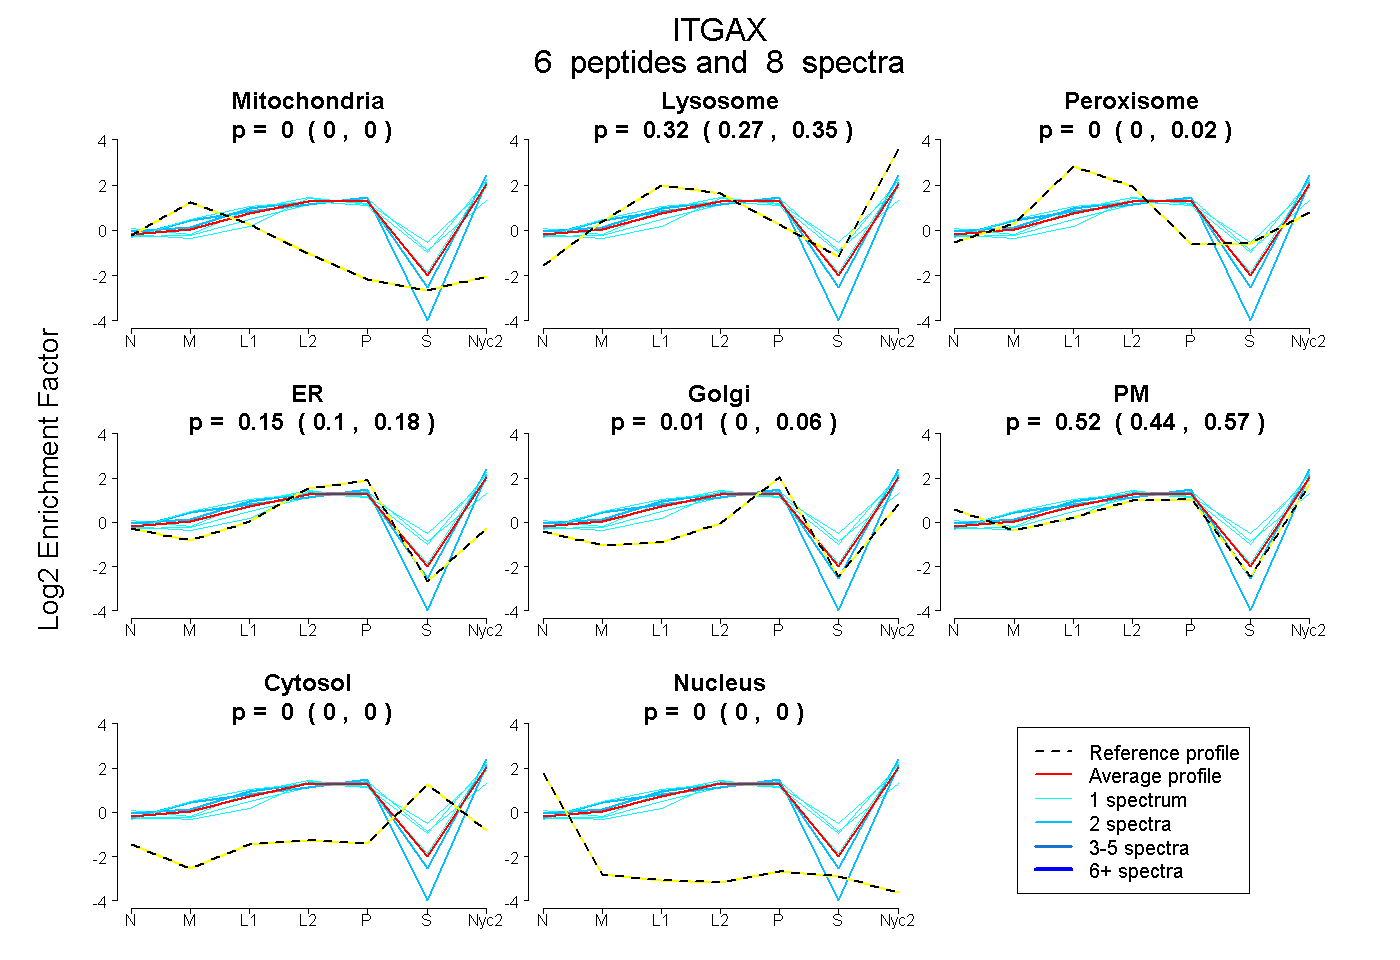
| Expt A |
6 peptides |
8 spectra |
|
0.000 0.000 | 0.000 |
0.317 0.269 | 0.350 |
0.000 0.000 | 0.016 |
0.150 0.100 | 0.181 |
0.014 0.000 | 0.063 |
0.518 0.435 | 0.574 |
0.000 0.000 | 0.000 |
0.000 0.000 | 0.000 |
| 1 spectrum, LLDFVNQLR | 0.006 | 0.438 | 0.000 | 0.103 | 0.000 | 0.452 | 0.000 | 0.000 | ||
| 1 spectrum, TRPILR | 0.000 | 0.344 | 0.000 | 0.120 | 0.000 | 0.385 | 0.151 | 0.000 | ||
| 1 spectrum, DIASSPSR | 0.000 | 0.315 | 0.100 | 0.008 | 0.000 | 0.539 | 0.039 | 0.000 | ||
| 2 spectra, GVHSLILGAPR | 0.000 | 0.295 | 0.000 | 0.021 | 0.000 | 0.683 | 0.000 | 0.000 | ||
| 2 spectra, GHLLLLR | 0.000 | 0.163 | 0.000 | 0.123 | 0.000 | 0.714 | 0.000 | 0.000 | ||
| 1 spectrum, FSLMQFSHTFR | 0.000 | 0.189 | 0.232 | 0.077 | 0.372 | 0.089 | 0.041 | 0.000 |
| Plot | Lyso | Other | |||||||||||
| Expt C |
5 peptides |
16 spectra |
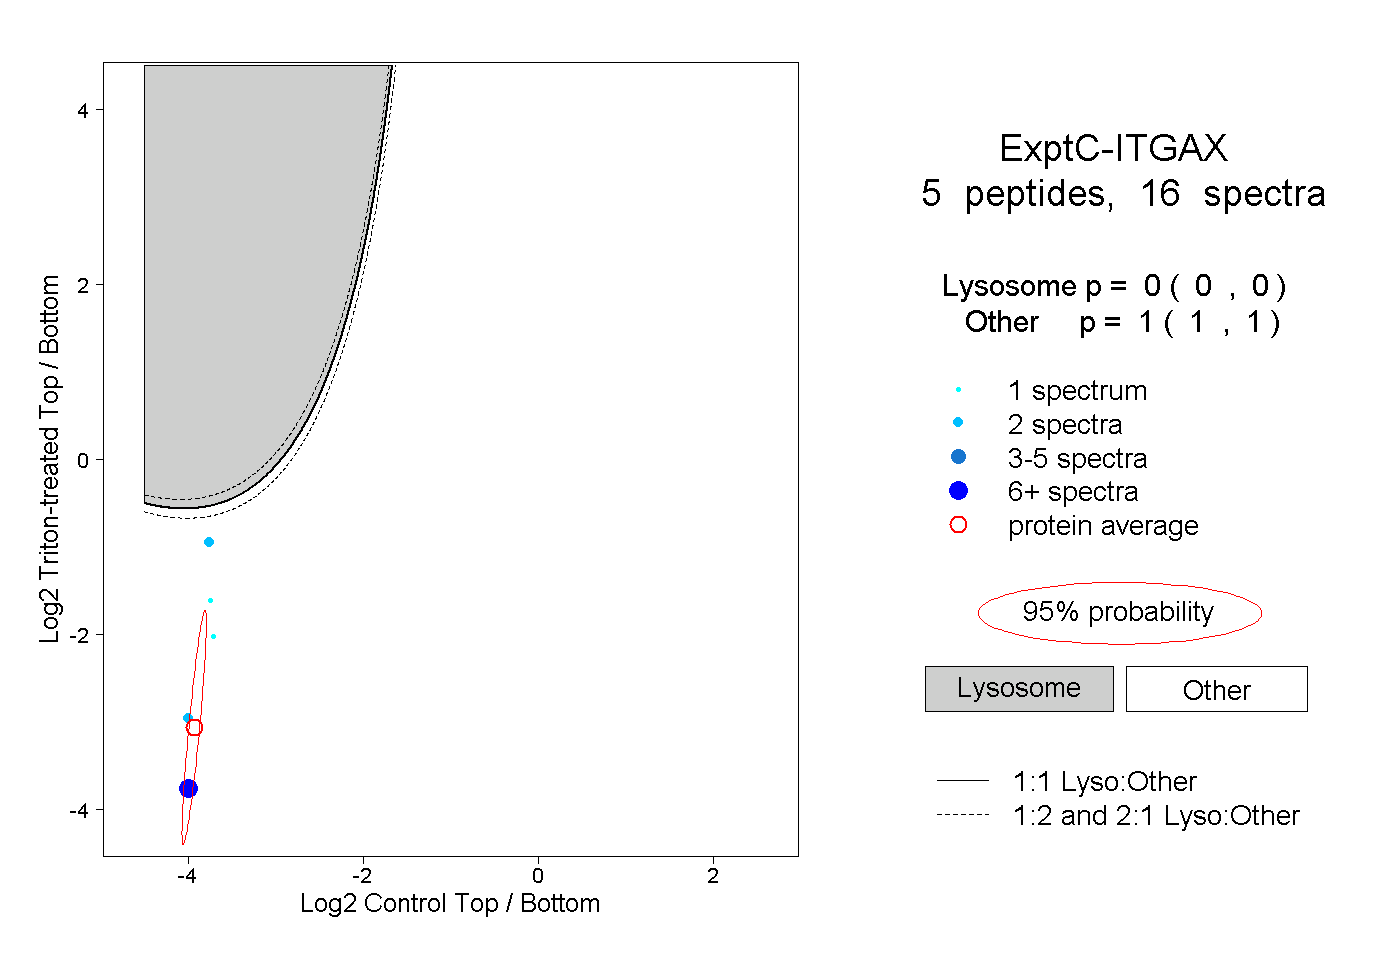 |
0.000 0.000 | 0.000 |
1.000 1.000 | 1.000 |
||||||||
| Plot | Lyso | Other | |||||||||||
| Expt D |
1 peptide |
1 spectrum |
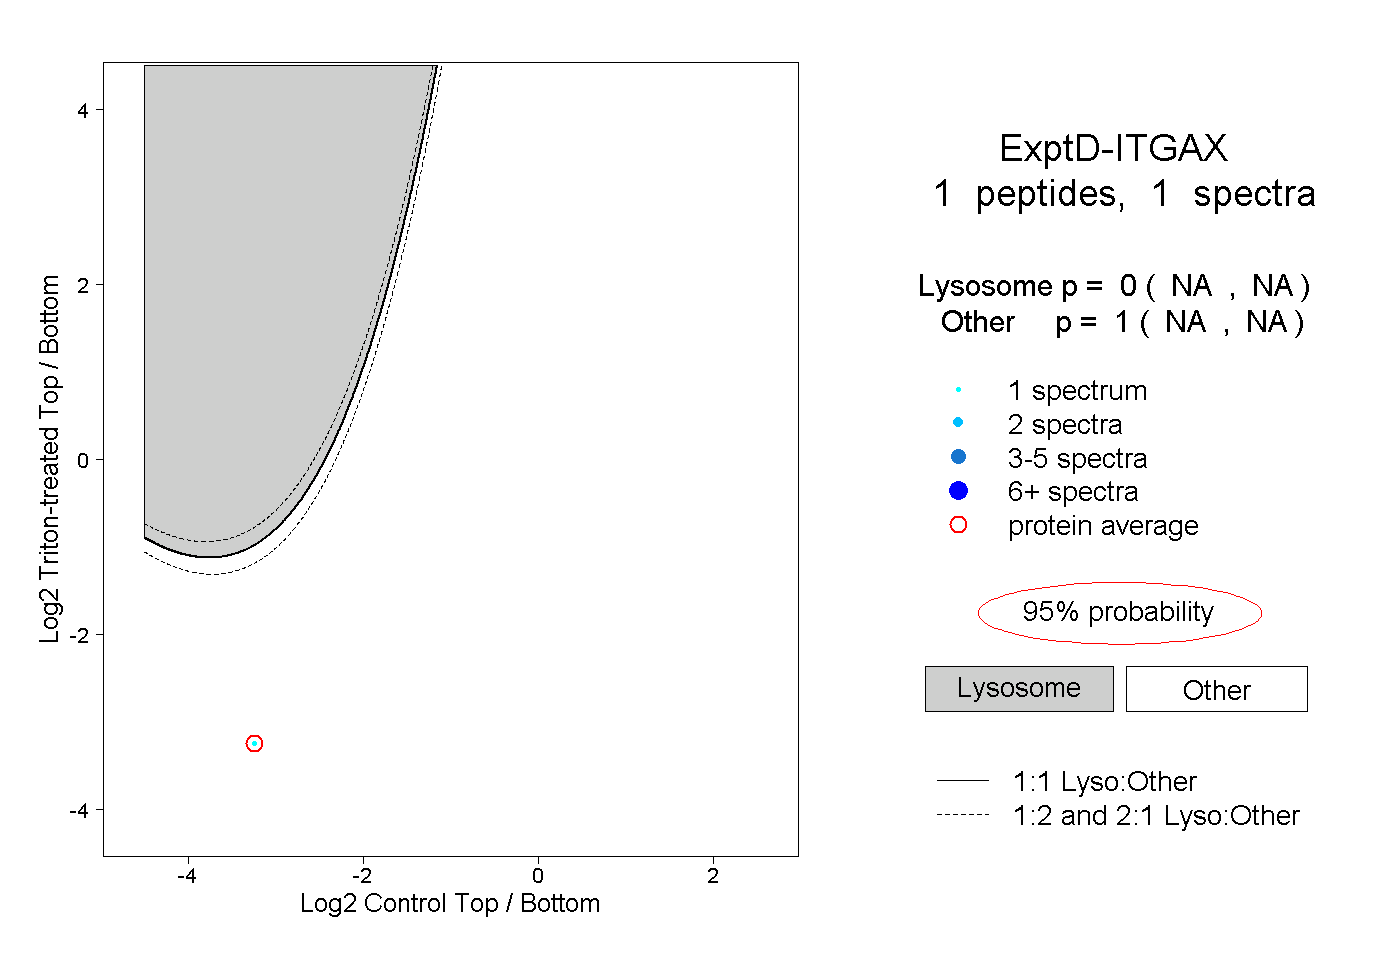 |
0.000 NA | NA |
1.000 NA | NA |