 13
13peptides
spectra
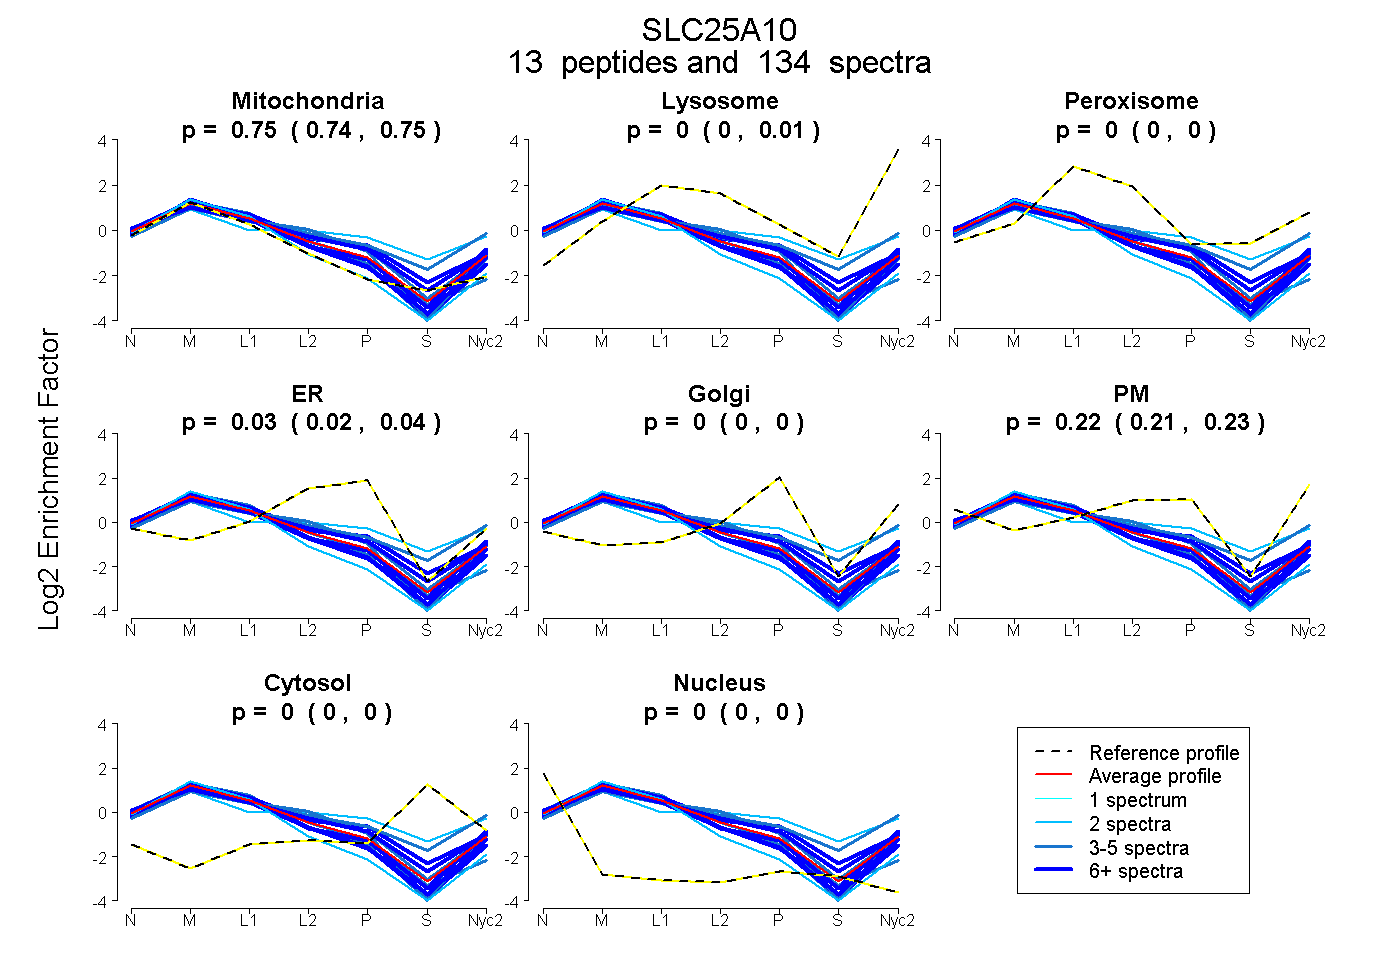
0.744 | 0.751
0.000 | 0.008
0.000 | 0.000
0.021 | 0.035
0.000 | 0.000
0.211 | 0.227
0.000 | 0.000
0.000 | 0.000
12peptides
spectra
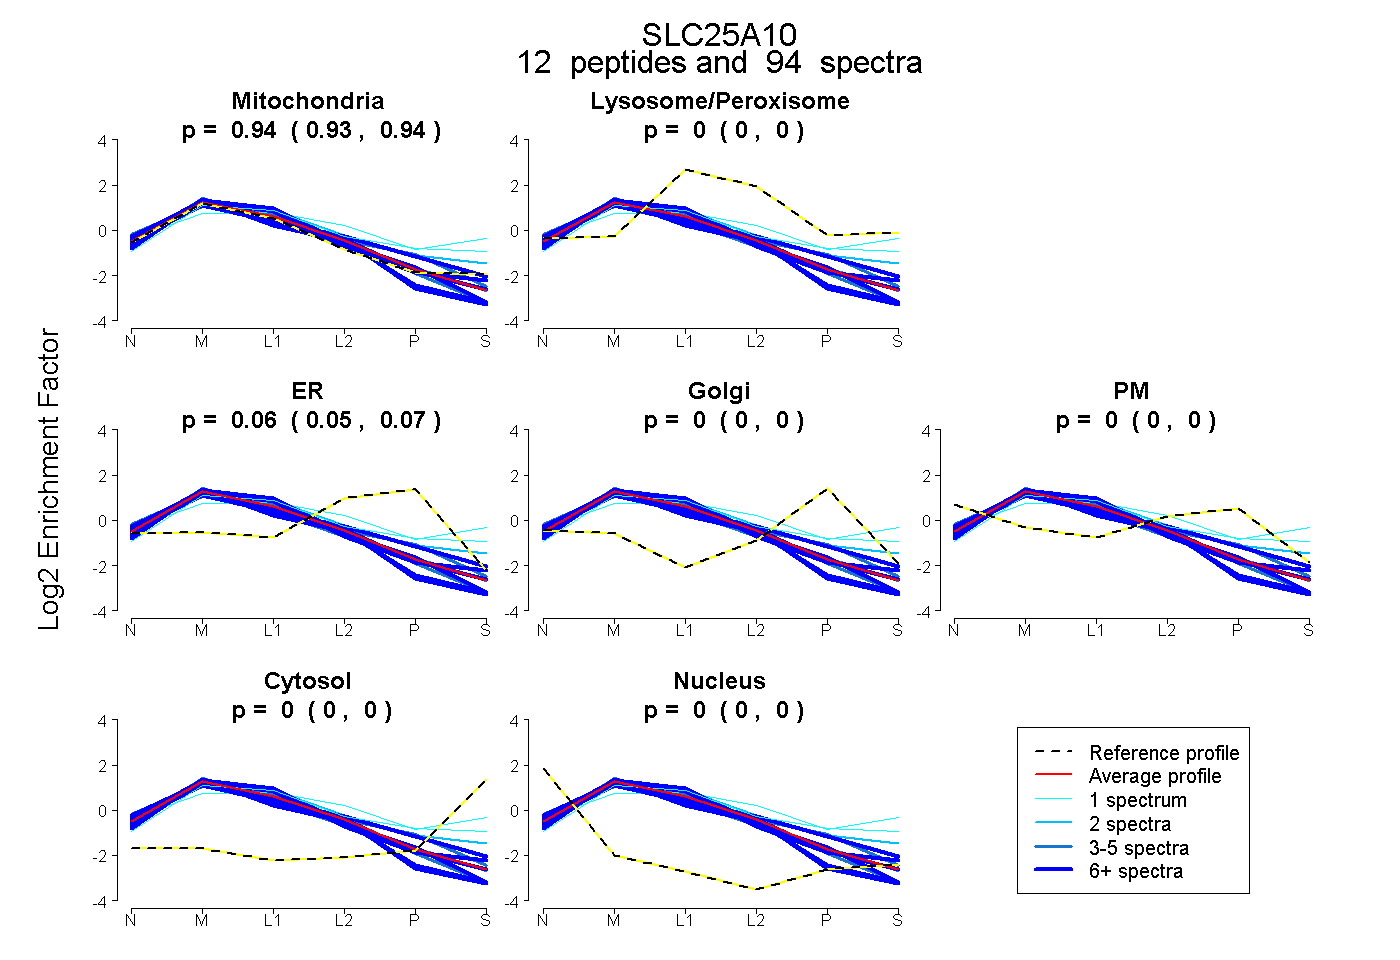
0.934 | 0.944
0.000 | 0.000
0.055 | 0.065
0.000 | 0.000
0.000 | 0.000
0.000 | 0.000
0.000 | 0.000
15peptides
spectra
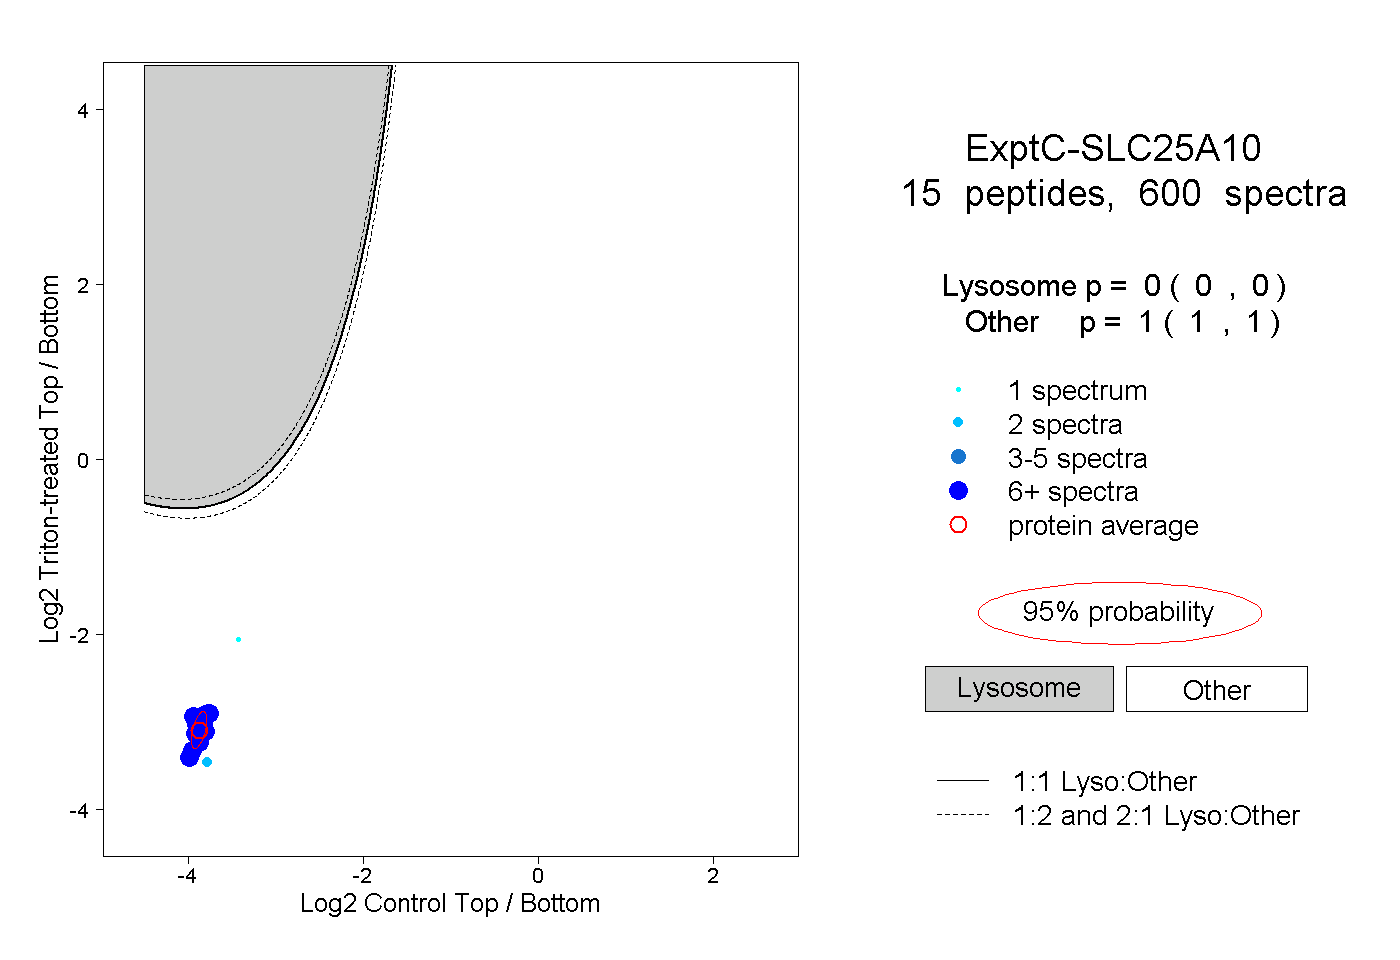
0.000 | 0.000
1.000 | 1.000
9peptides
spectra
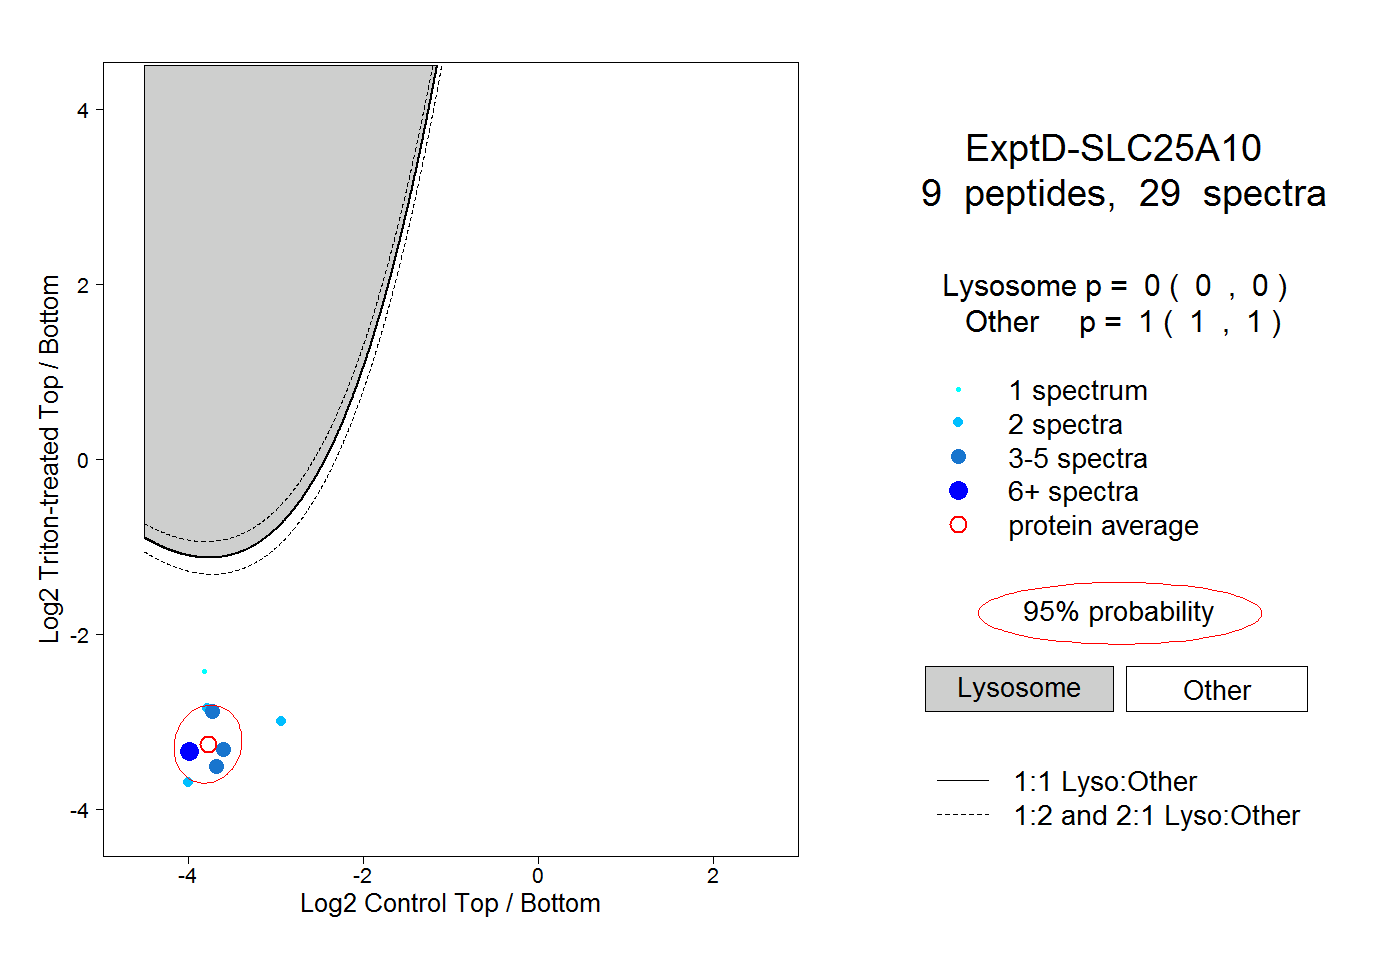
0.000 | 0.000
1.000 | 1.000