 13
13peptides
spectra
0.744 | 0.751
0.000 | 0.008
0.000 | 0.000
0.021 | 0.035
0.000 | 0.000
0.211 | 0.227
0.000 | 0.000
0.000 | 0.000
| Plot | Mito | Lyso | Perox | ER | Golgi | PM | Cytosol | Nucleus | |||||
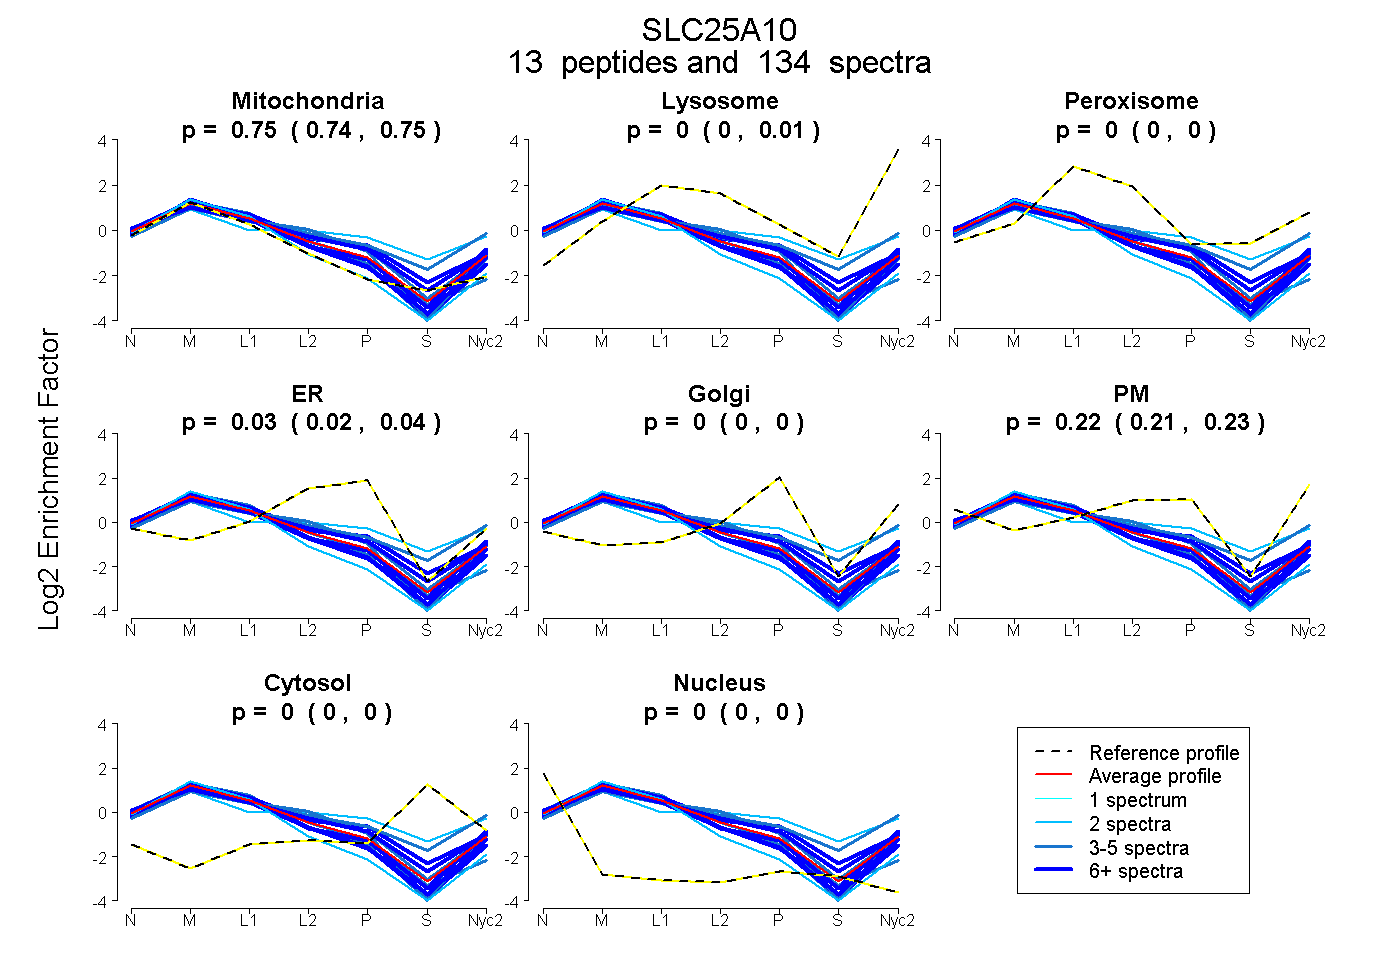
| Expt A |
13 peptides |
134 spectra |
|
0.748 0.744 | 0.751 |
0.004 0.000 | 0.008 |
0.000 0.000 | 0.000 |
0.029 0.021 | 0.035 |
0.000 0.000 | 0.000 |
0.219 0.211 | 0.227 |
0.000 0.000 | 0.000 |
0.000 0.000 | 0.000 |
| 3 spectra, DSQGPLPFYSK | 0.814 | 0.000 | 0.000 | 0.000 | 0.000 | 0.186 | 0.000 | 0.000 | ||
| 12 spectra, VHLQTQQEVK | 0.661 | 0.000 | 0.022 | 0.076 | 0.000 | 0.241 | 0.000 | 0.000 | ||
| 3 spectra, GEYQGVFHCAVETAK | 0.839 | 0.000 | 0.000 | 0.161 | 0.000 | 0.000 | 0.000 | 0.000 | ||
| 3 spectra, NYSHALDGLYR | 0.518 | 0.177 | 0.055 | 0.000 | 0.082 | 0.131 | 0.037 | 0.000 | ||
| 13 spectra, LFSGATMASSR | 0.623 | 0.000 | 0.126 | 0.091 | 0.065 | 0.095 | 0.000 | 0.000 | ||
| 19 spectra, QMTYSLTR | 0.762 | 0.004 | 0.000 | 0.000 | 0.000 | 0.234 | 0.000 | 0.000 | ||
| 2 spectra, GALVTVGQLSCYDQAK | 0.423 | 0.067 | 0.140 | 0.000 | 0.192 | 0.101 | 0.077 | 0.000 | ||
| 26 spectra, GLVPAGVR | 0.856 | 0.000 | 0.000 | 0.005 | 0.000 | 0.140 | 0.000 | 0.000 | ||
| 6 spectra, FAIYETMR | 0.792 | 0.025 | 0.000 | 0.000 | 0.000 | 0.184 | 0.000 | 0.000 | ||
| 4 spectra, LGPQAFFK | 0.688 | 0.005 | 0.000 | 0.134 | 0.000 | 0.173 | 0.000 | 0.000 | ||
| 2 spectra, WYFGGLASCGAACCTHPLDLLK | 0.994 | 0.000 | 0.000 | 0.000 | 0.000 | 0.006 | 0.000 | 0.000 | ||
| 38 spectra, MTGMALQVVR | 0.834 | 0.000 | 0.000 | 0.000 | 0.000 | 0.166 | 0.000 | 0.000 | ||
| 3 spectra, MQNDMK | 0.675 | 0.000 | 0.000 | 0.138 | 0.000 | 0.187 | 0.000 | 0.000 |
| Plot | Mito | Lyso or Perox | ER | Golgi | PM | Cytosol | Nucleus | ||||||
| Expt B |
12 peptides |
94 spectra |
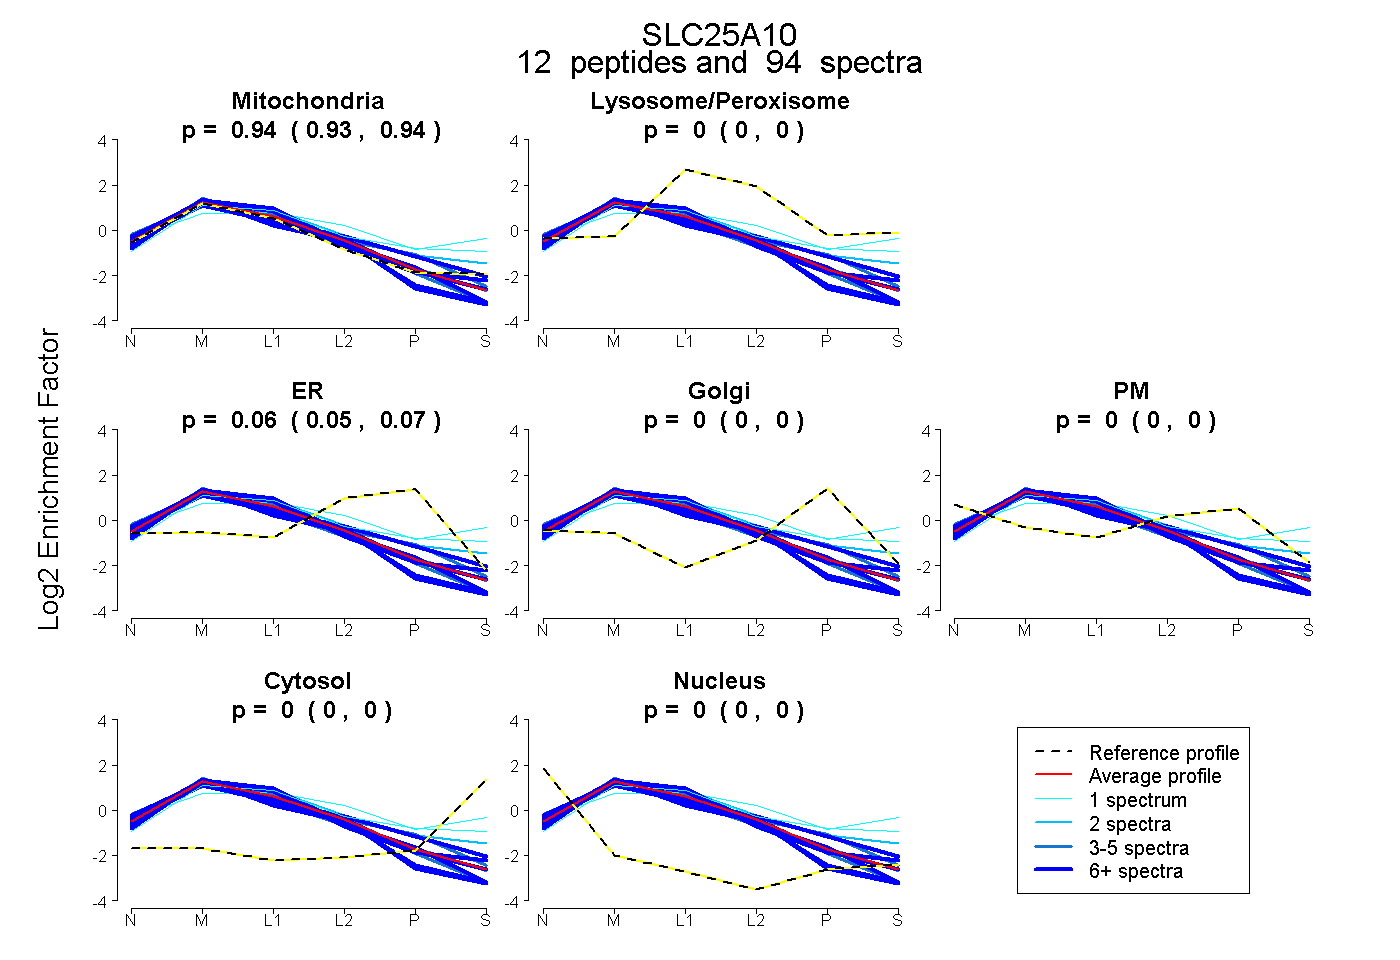 |
0.940 0.934 | 0.944 |
0.000 0.000 | 0.000 |
0.060 0.055 | 0.065 |
0.000 0.000 | 0.000 |
0.000 0.000 | 0.000 |
0.000 0.000 | 0.000 |
0.000 0.000 | 0.000 |
|||
| Plot | Lyso | Other | |||||||||||
| Expt C |
15 peptides |
600 spectra |
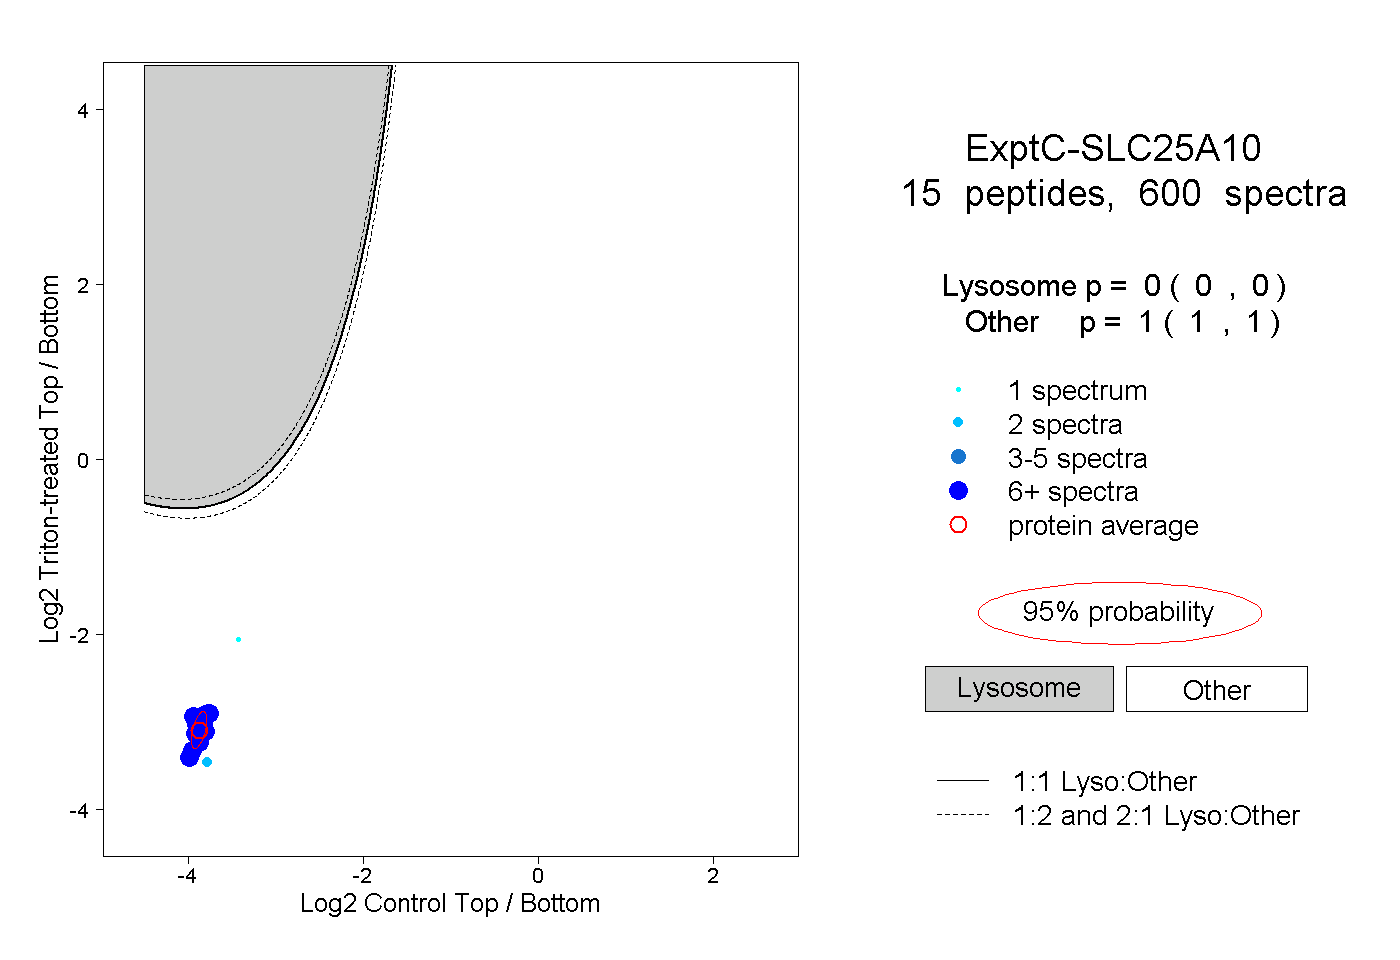 |
0.000 0.000 | 0.000 |
1.000 1.000 | 1.000 |
||||||||
| Plot | Lyso | Other | |||||||||||
| Expt D |
9 peptides |
29 spectra |
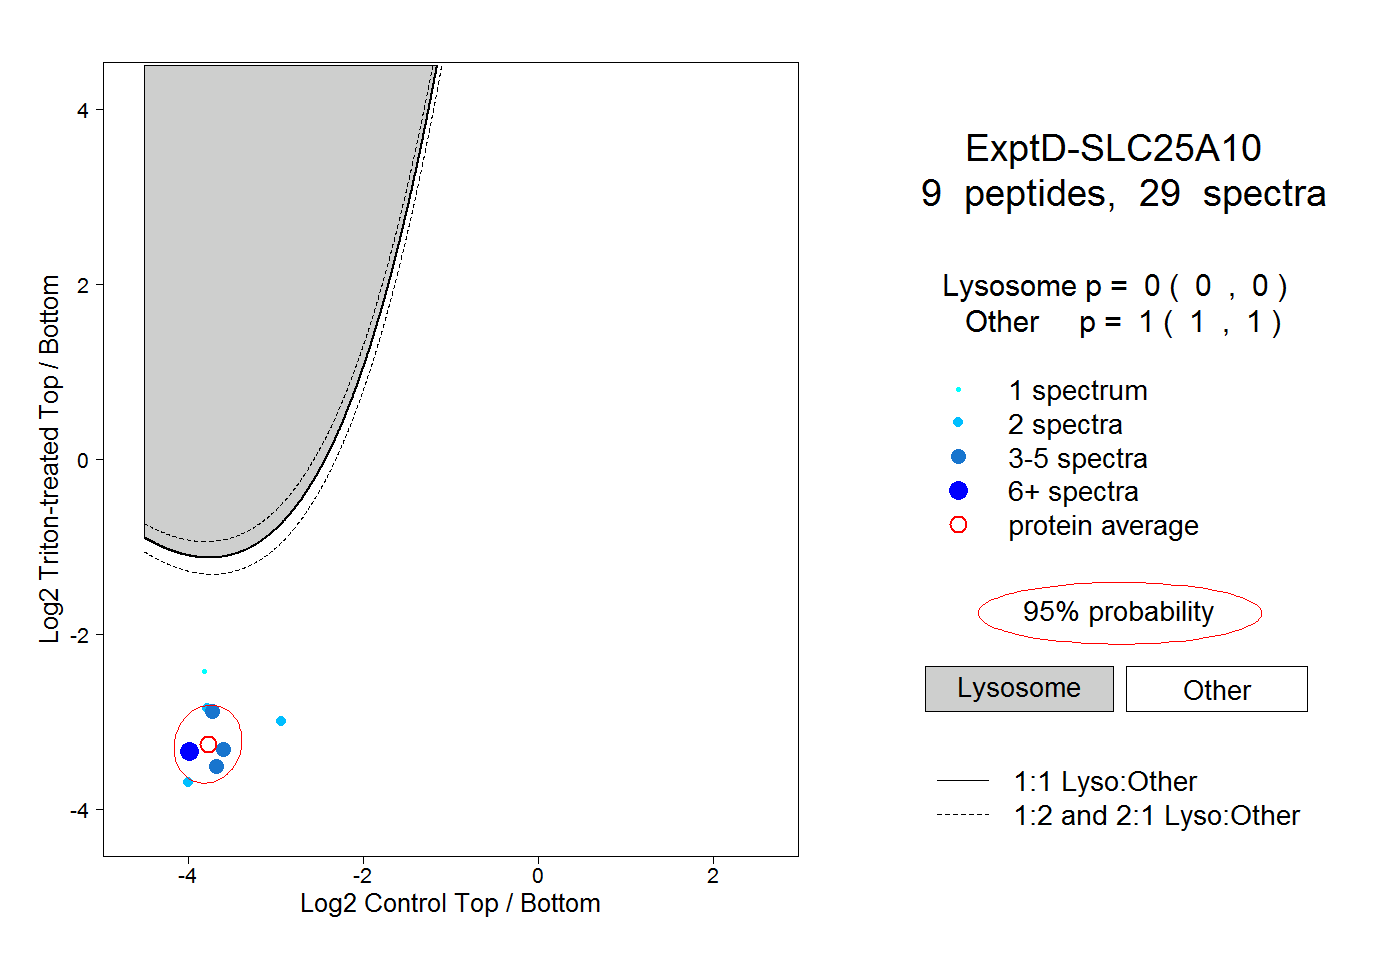 |
0.000 0.000 | 0.000 |
1.000 1.000 | 1.000 |