 5
5peptides
spectra
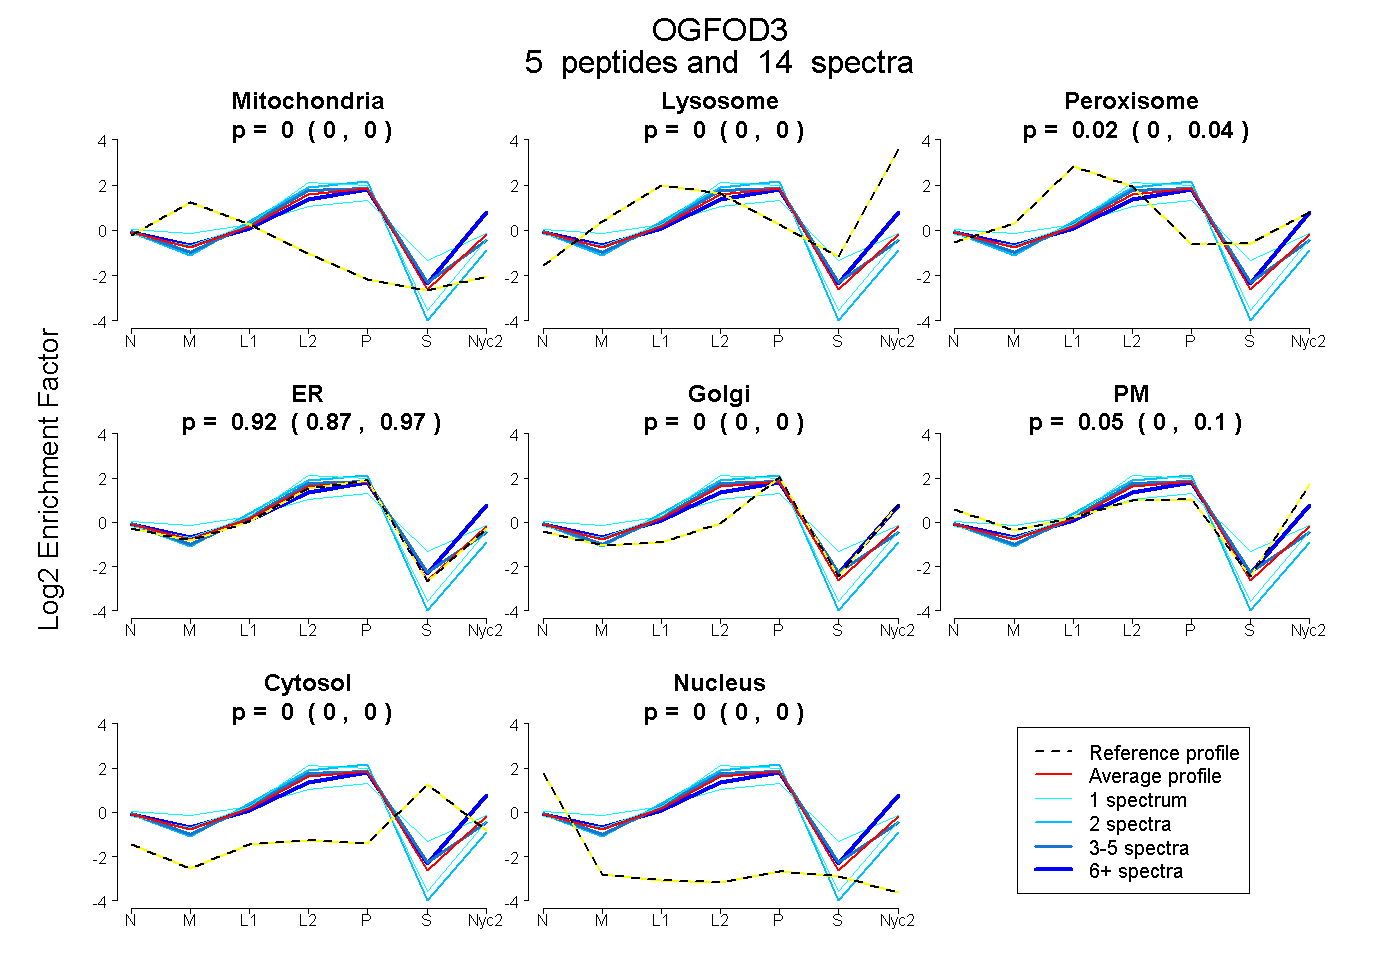
0.000 | 0.004
0.000 | 0.000
0.000 | 0.043
0.870 | 0.967
0.000 | 0.000
0.000 | 0.103
0.000 | 0.000
0.000 | 0.004
2peptides
spectra
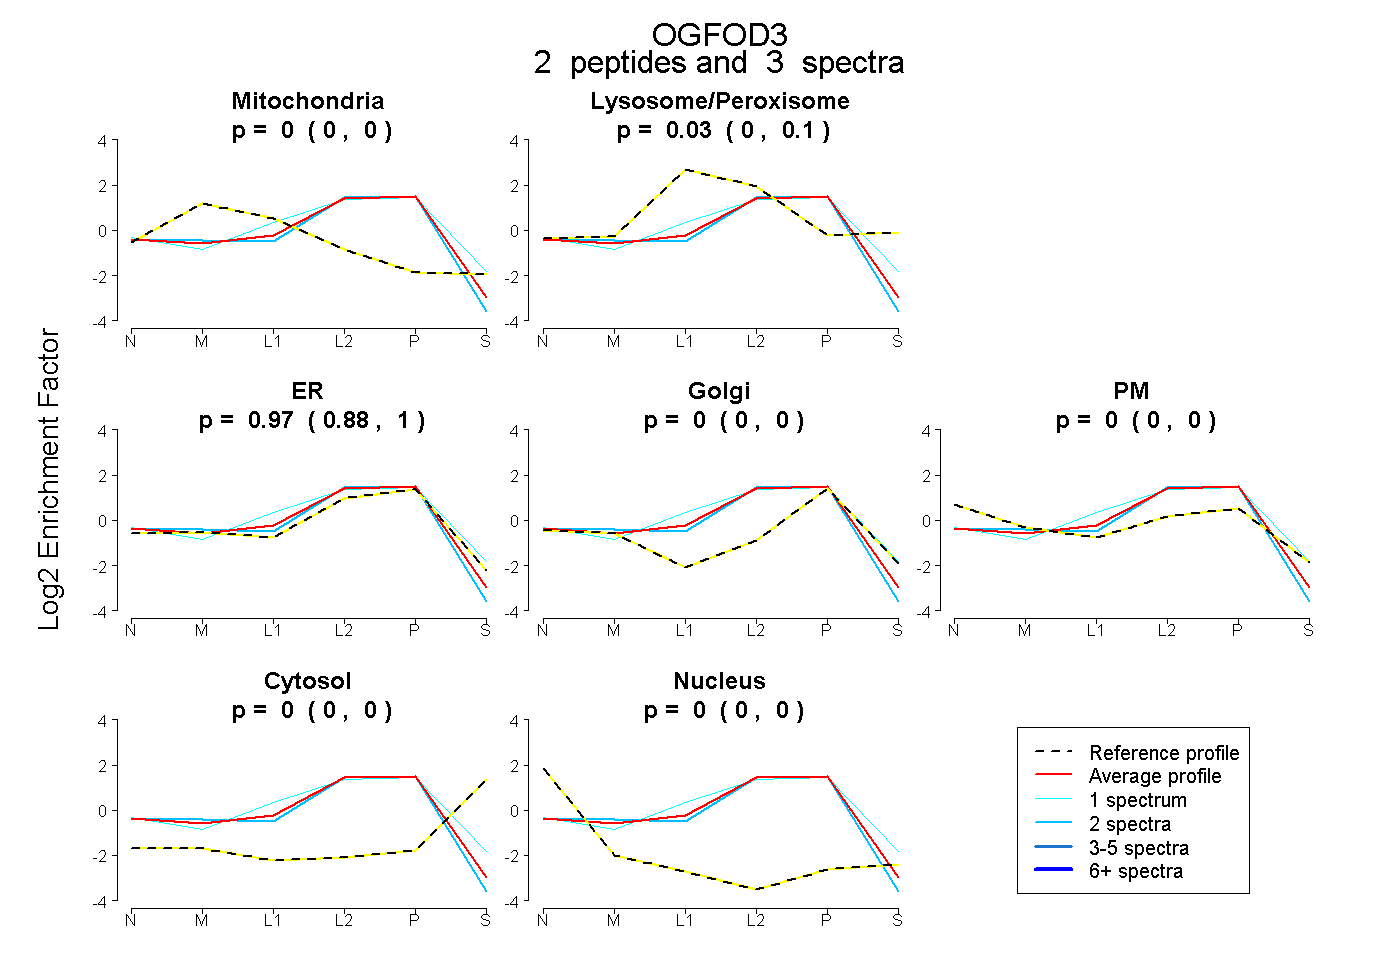
0.000 | 0.000
0.000 | 0.104
0.876 | 1.000
0.000 | 0.000
0.000 | 0.000
0.000 | 0.000
0.000 | 0.000
4peptides
spectra
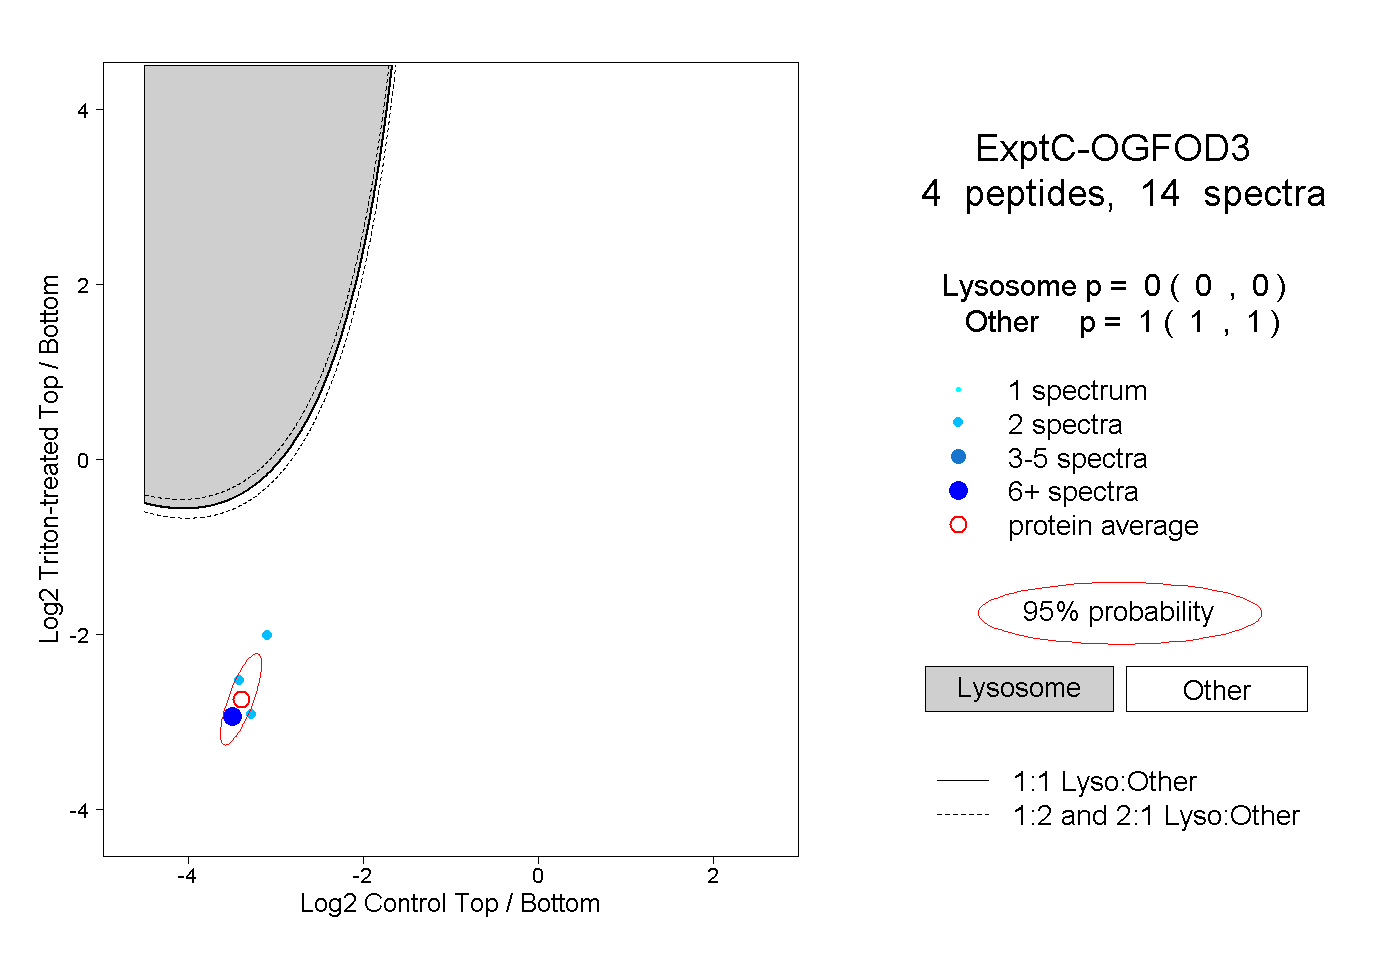
0.000 | 0.000
1.000 | 1.000