 5
5peptides
spectra
0.000 | 0.004
0.000 | 0.000
0.000 | 0.043
0.870 | 0.967
0.000 | 0.000
0.000 | 0.103
0.000 | 0.000
0.000 | 0.004
| Plot | Mito | Lyso | Perox | ER | Golgi | PM | Cytosol | Nucleus | |||||
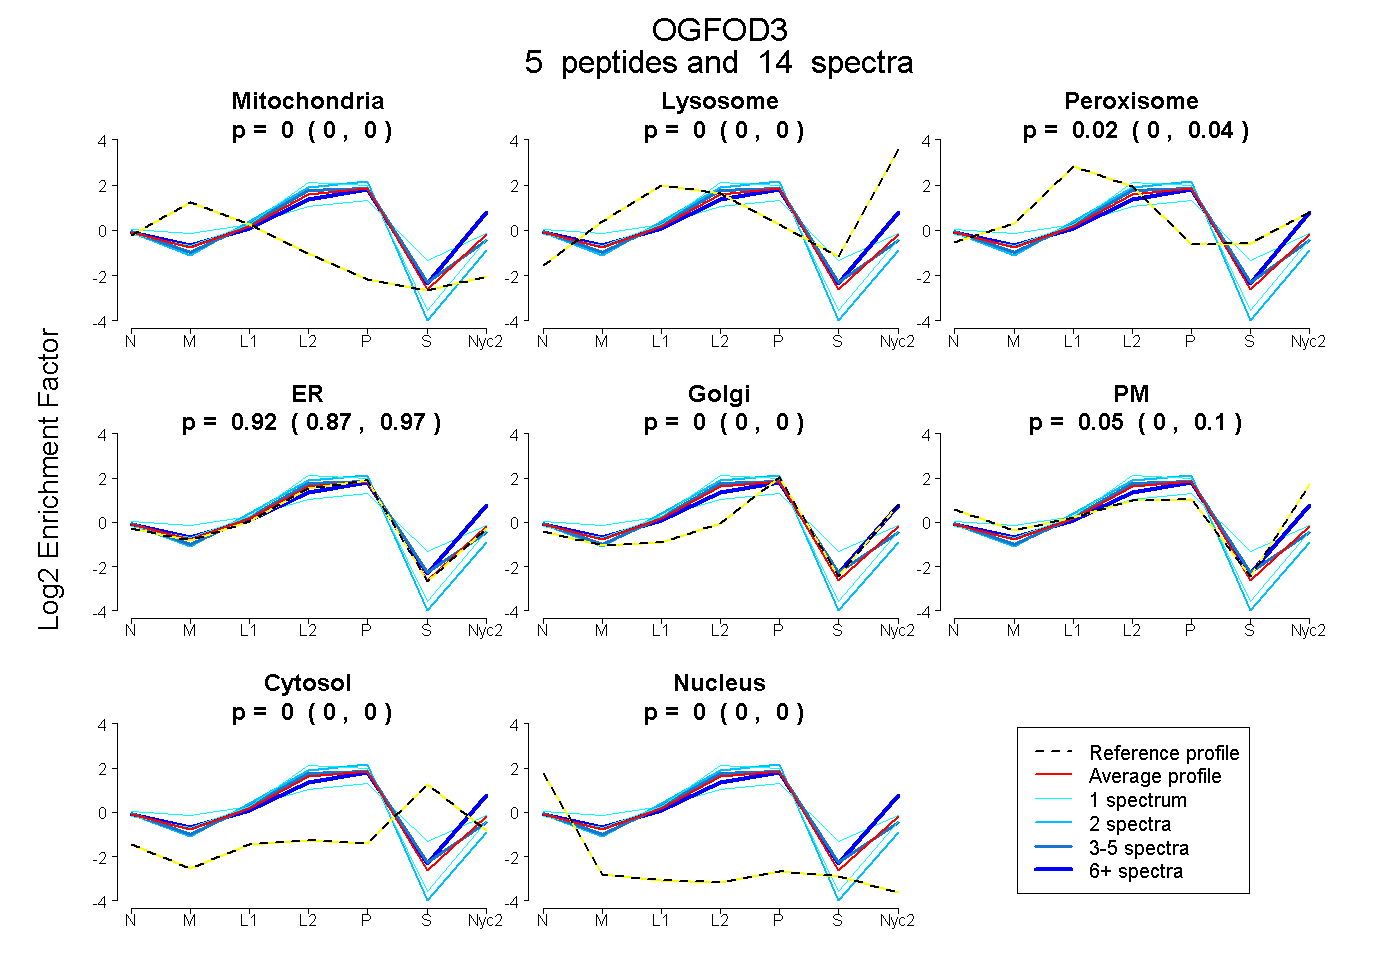
| Expt A |
5 peptides |
14 spectra |
|
0.000 0.000 | 0.004 |
0.000 0.000 | 0.000 |
0.023 0.000 | 0.043 |
0.924 0.870 | 0.967 |
0.000 0.000 | 0.000 |
0.053 0.000 | 0.103 |
0.000 0.000 | 0.000 |
0.000 0.000 | 0.004 |
| 1 spectrum, VLWGTR | 0.000 | 0.000 | 0.000 | 1.000 | 0.000 | 0.000 | 0.000 | 0.000 | ||
| 3 spectra, IQTIFSEEDFQLYR | 0.000 | 0.000 | 0.048 | 0.940 | 0.000 | 0.000 | 0.012 | 0.000 | ||
| 7 spectra, HFVNLYR | 0.000 | 0.076 | 0.000 | 0.538 | 0.123 | 0.263 | 0.000 | 0.000 | ||
| 1 spectrum, FIEVPCSEDYDGHR | 0.036 | 0.000 | 0.207 | 0.507 | 0.122 | 0.046 | 0.081 | 0.000 | ||
| 2 spectra, GVTDIVITR | 0.000 | 0.000 | 0.000 | 1.000 | 0.000 | 0.000 | 0.000 | 0.000 |
| Plot | Mito | Lyso or Perox | ER | Golgi | PM | Cytosol | Nucleus | ||||||
| Expt B |
2 peptides |
3 spectra |
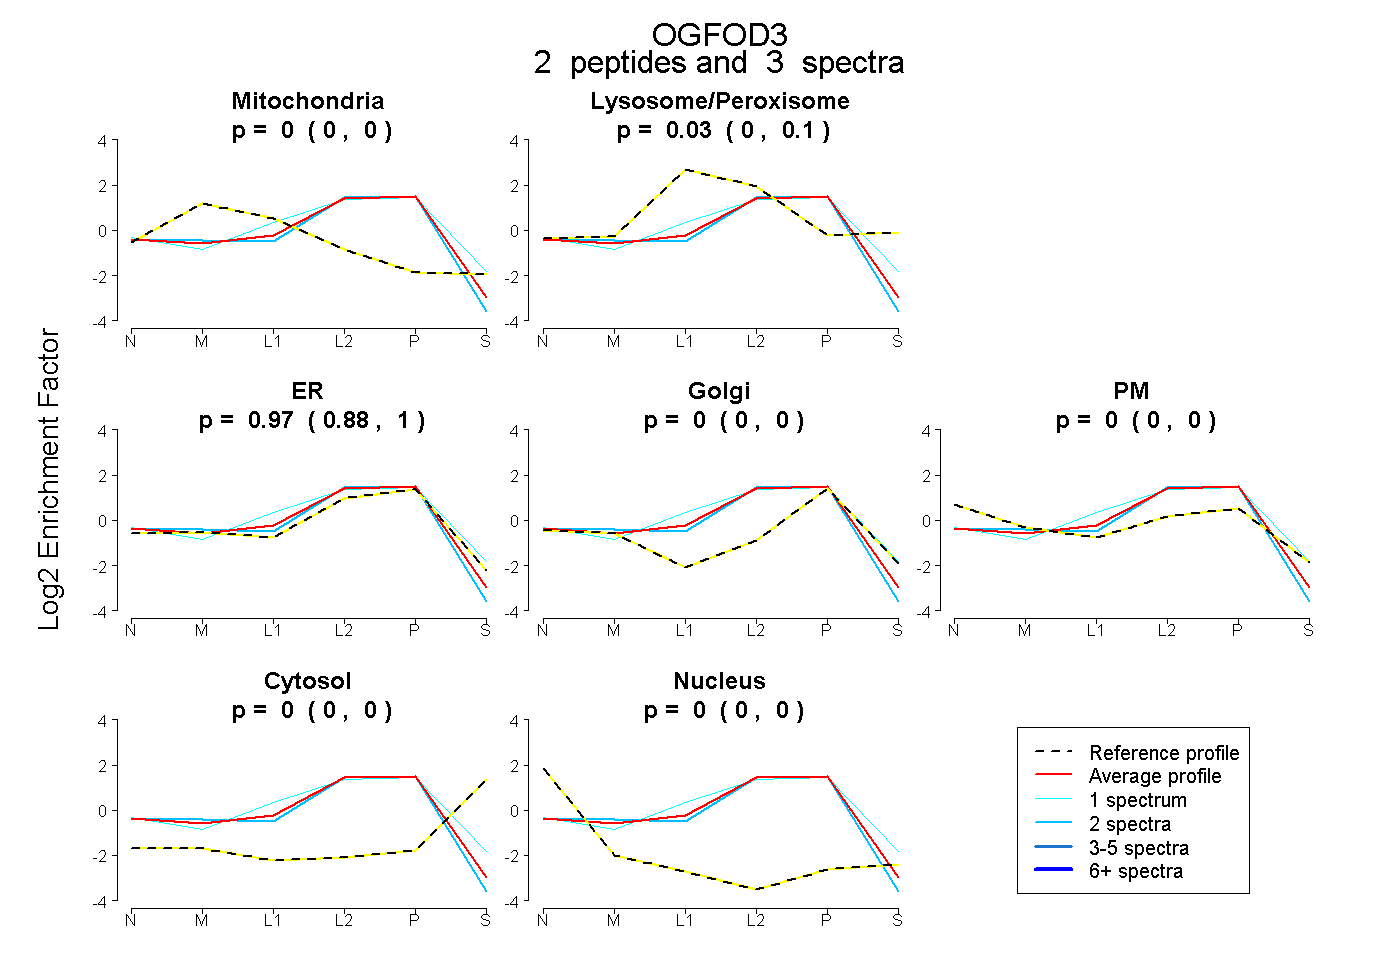 |
0.000 0.000 | 0.000 |
0.027 0.000 | 0.104 |
0.973 0.876 | 1.000 |
0.000 0.000 | 0.000 |
0.000 0.000 | 0.000 |
0.000 0.000 | 0.000 |
0.000 0.000 | 0.000 |
|||
| Plot | Lyso | Other | |||||||||||
| Expt C |
4 peptides |
14 spectra |
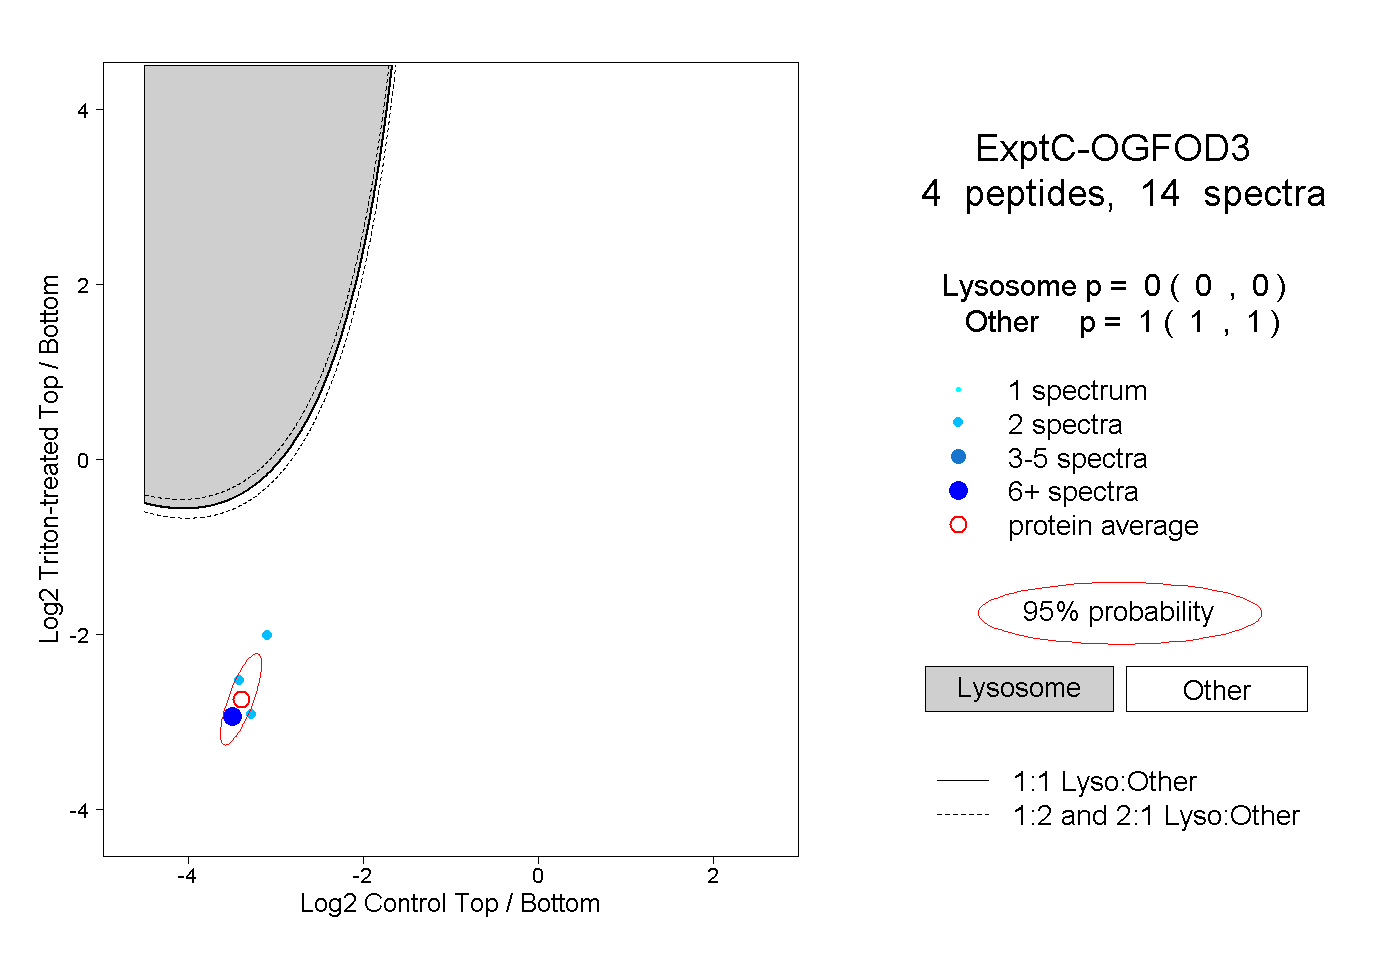 |
0.000 0.000 | 0.000 |
1.000 1.000 | 1.000 |