 7
7peptides
spectra
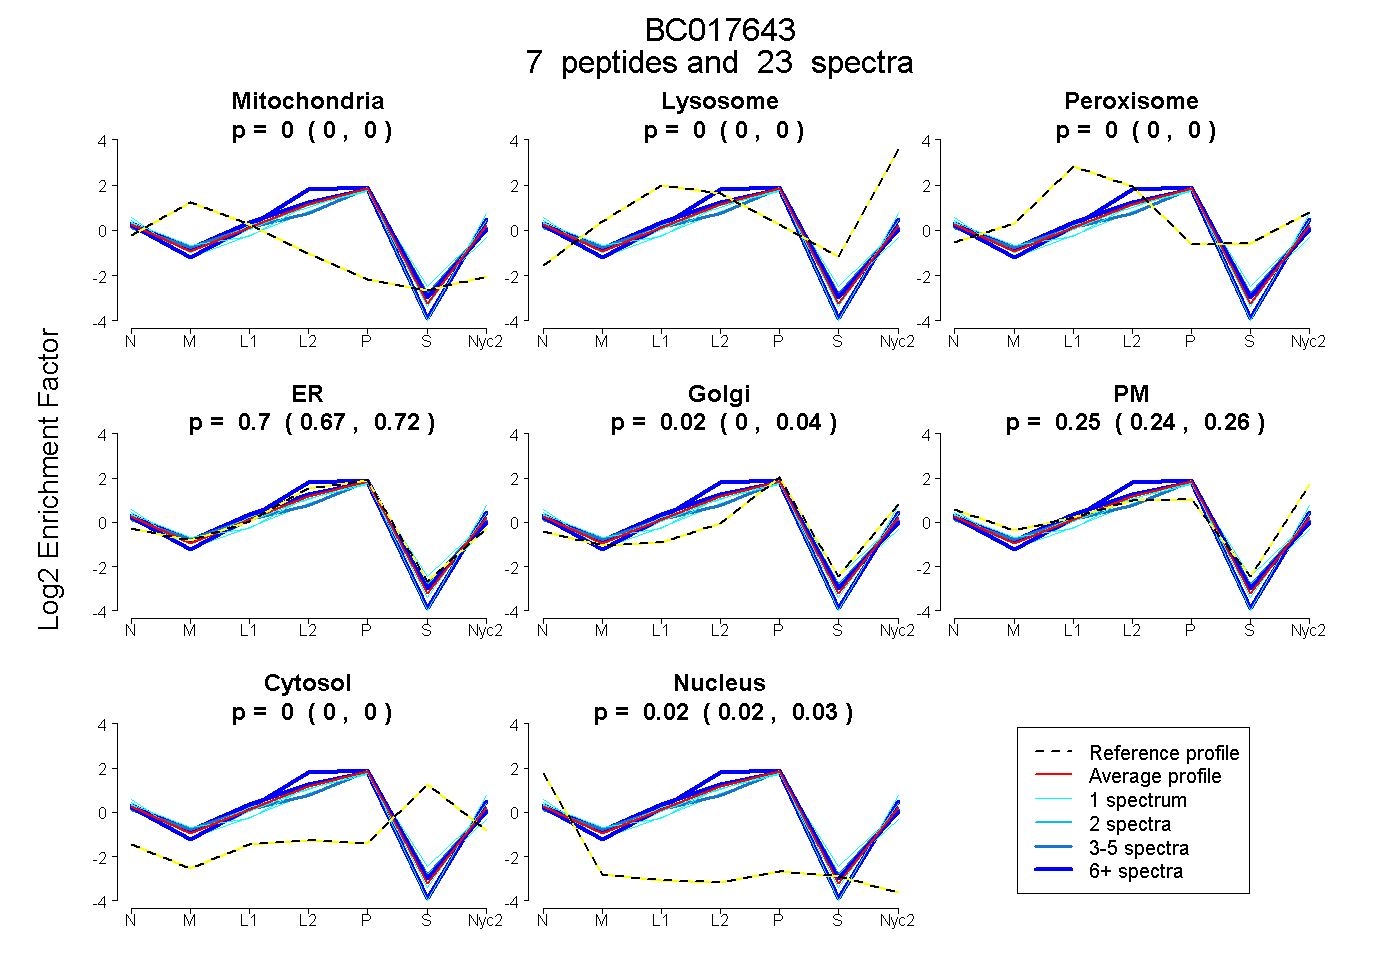
0.000 | 0.000
0.000 | 0.000
0.000 | 0.000
0.674 | 0.724
0.000 | 0.044
0.235 | 0.264
0.000 | 0.000
0.019 | 0.027
2peptides
spectra
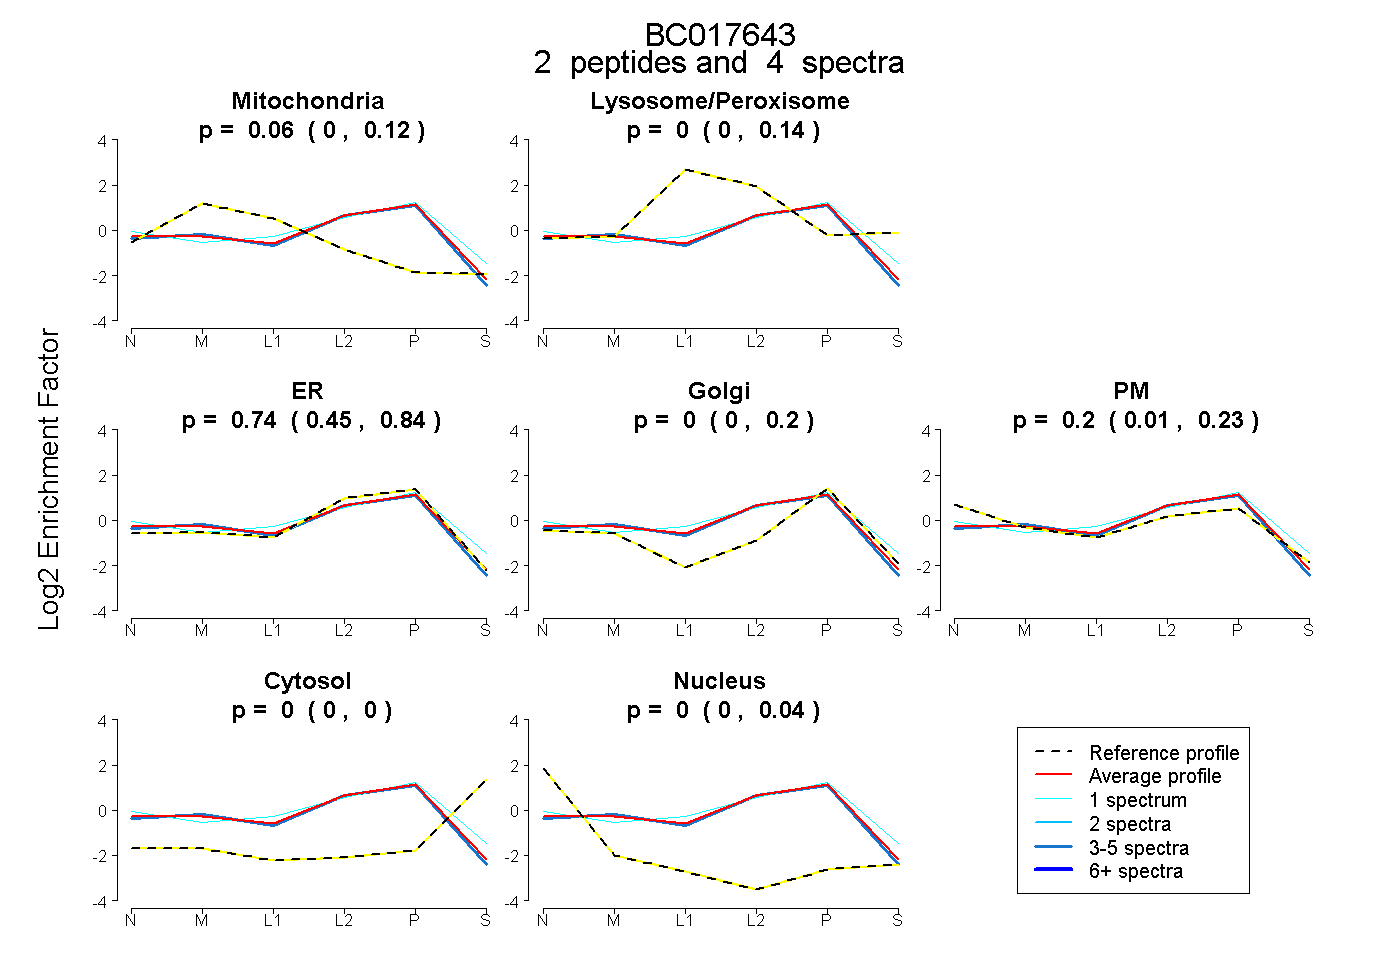
0.000 | 0.117
0.000 | 0.140
0.447 | 0.837
0.000 | 0.196
0.015 | 0.234
0.000 | 0.000
0.000 | 0.035
6peptides
spectra
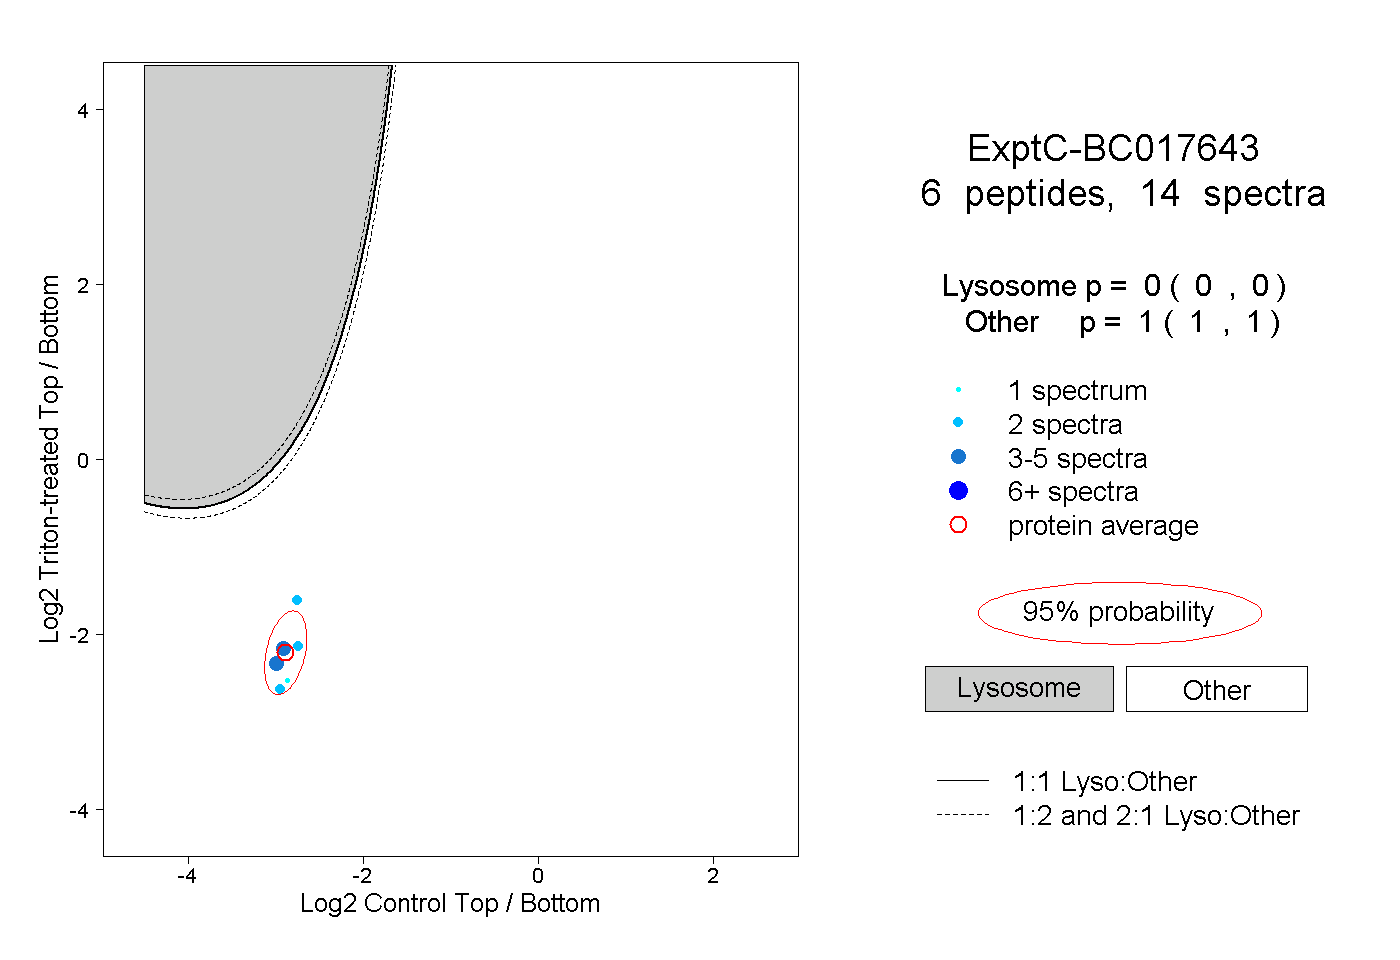
0.000 | 0.000
1.000 | 1.000
1peptide
spectrum
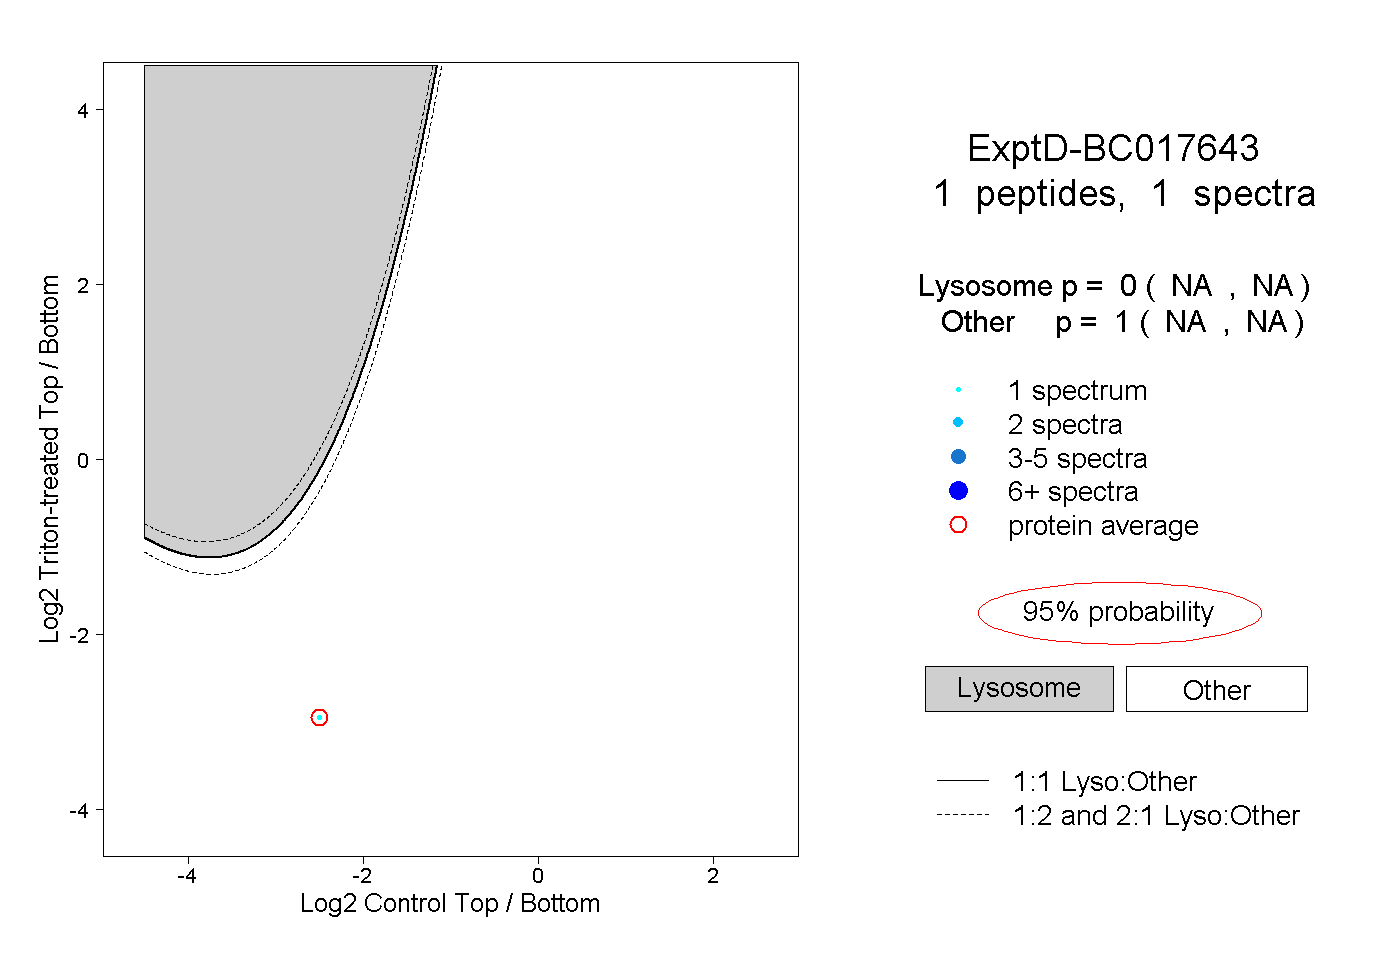
NA | NA
NA | NA