 7
7peptides
spectra
0.000 | 0.000
0.000 | 0.000
0.000 | 0.000
0.674 | 0.724
0.000 | 0.044
0.235 | 0.264
0.000 | 0.000
0.019 | 0.027
| Plot | Mito | Lyso | Perox | ER | Golgi | PM | Cytosol | Nucleus | |||||
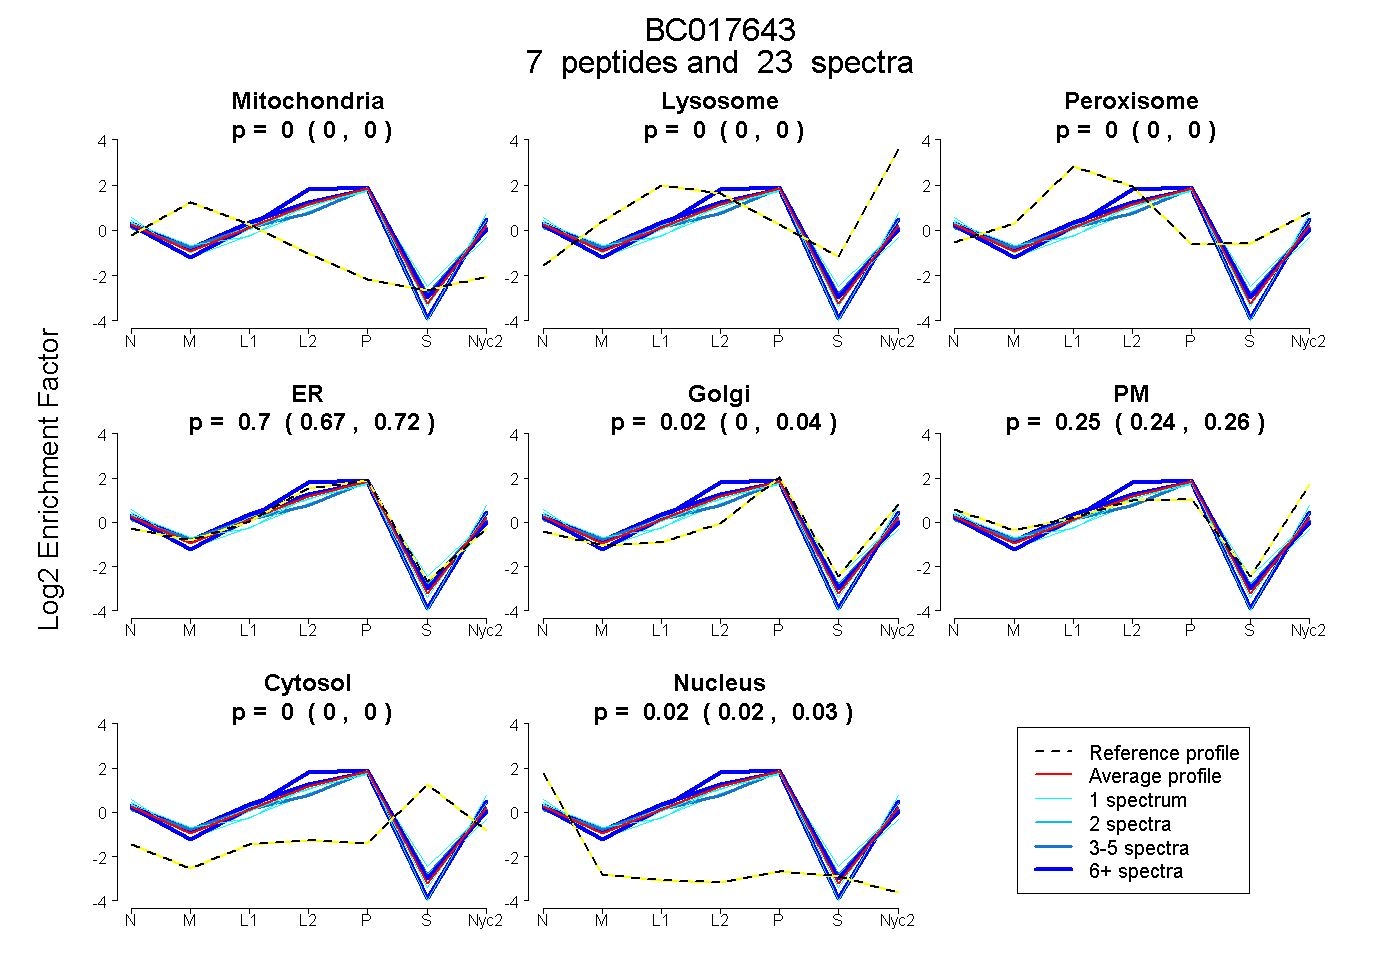
| Expt A |
7 peptides |
23 spectra |
|
0.000 0.000 | 0.000 |
0.000 0.000 | 0.000 |
0.000 0.000 | 0.000 |
0.702 0.674 | 0.724 |
0.023 0.000 | 0.044 |
0.251 0.235 | 0.264 |
0.000 0.000 | 0.000 |
0.023 0.019 | 0.027 |
| 1 spectrum, TFSLYK | 0.000 | 0.000 | 0.000 | 0.523 | 0.094 | 0.383 | 0.000 | 0.000 | ||
| 1 spectrum, LESPSER | 0.000 | 0.000 | 0.000 | 0.777 | 0.000 | 0.139 | 0.000 | 0.084 | ||
| 6 spectra, LITSFLELHR | 0.000 | 0.000 | 0.000 | 0.891 | 0.000 | 0.109 | 0.000 | 0.000 | ||
| 1 spectrum, MYMQVETR | 0.000 | 0.000 | 0.000 | 0.572 | 0.081 | 0.321 | 0.000 | 0.027 | ||
| 5 spectra, GYMVVLR | 0.008 | 0.000 | 0.000 | 0.604 | 0.185 | 0.180 | 0.000 | 0.024 | ||
| 8 spectra, FATGFSHPLTQSAVMGR | 0.000 | 0.000 | 0.000 | 0.657 | 0.000 | 0.343 | 0.000 | 0.000 | ||
| 1 spectrum, DIQDVNVEEEK | 0.000 | 0.000 | 0.000 | 0.555 | 0.177 | 0.202 | 0.000 | 0.066 |
| Plot | Mito | Lyso or Perox | ER | Golgi | PM | Cytosol | Nucleus | ||||||
| Expt B |
2 peptides |
4 spectra |
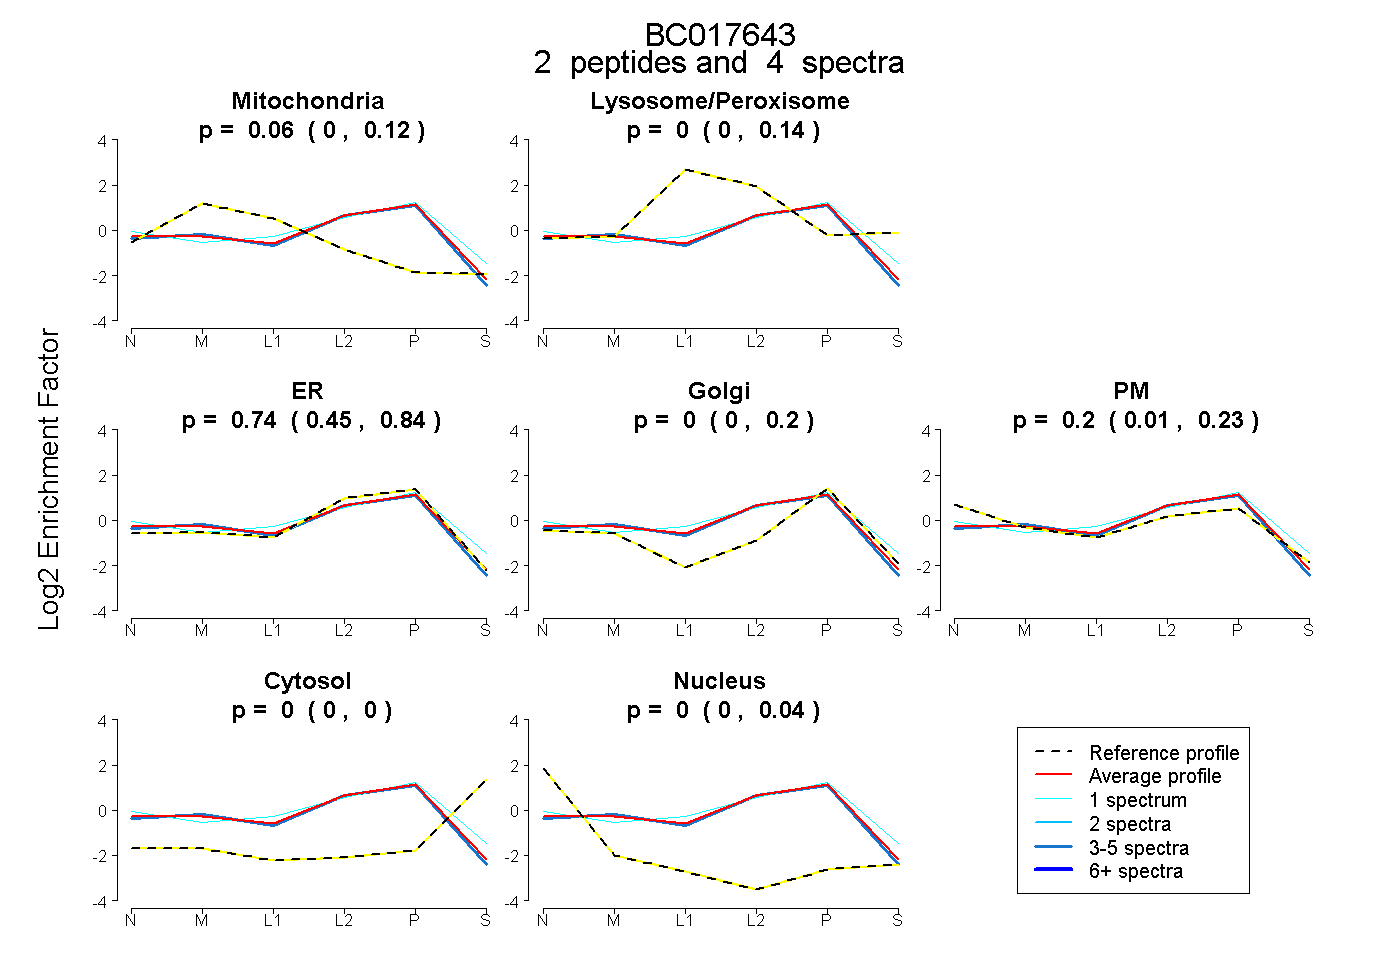 |
0.062 0.000 | 0.117 |
0.000 0.000 | 0.140 |
0.741 0.447 | 0.837 |
0.000 0.000 | 0.196 |
0.196 0.015 | 0.234 |
0.000 0.000 | 0.000 |
0.000 0.000 | 0.035 |
|||
| Plot | Lyso | Other | |||||||||||
| Expt C |
6 peptides |
14 spectra |
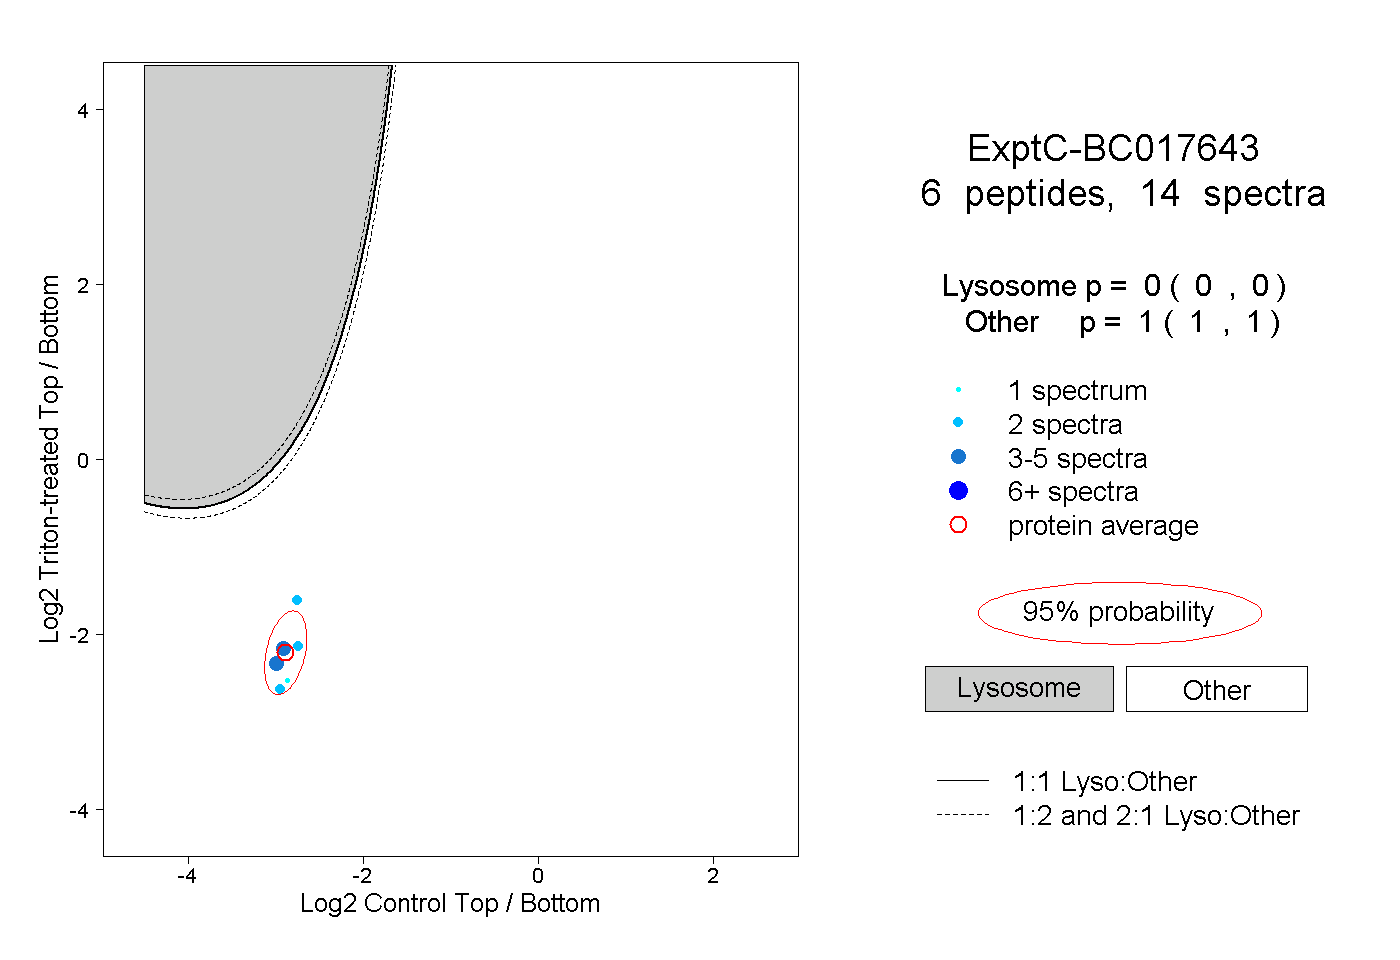 |
0.000 0.000 | 0.000 |
1.000 1.000 | 1.000 |
||||||||
| Plot | Lyso | Other | |||||||||||
| Expt D |
1 peptide |
1 spectrum |
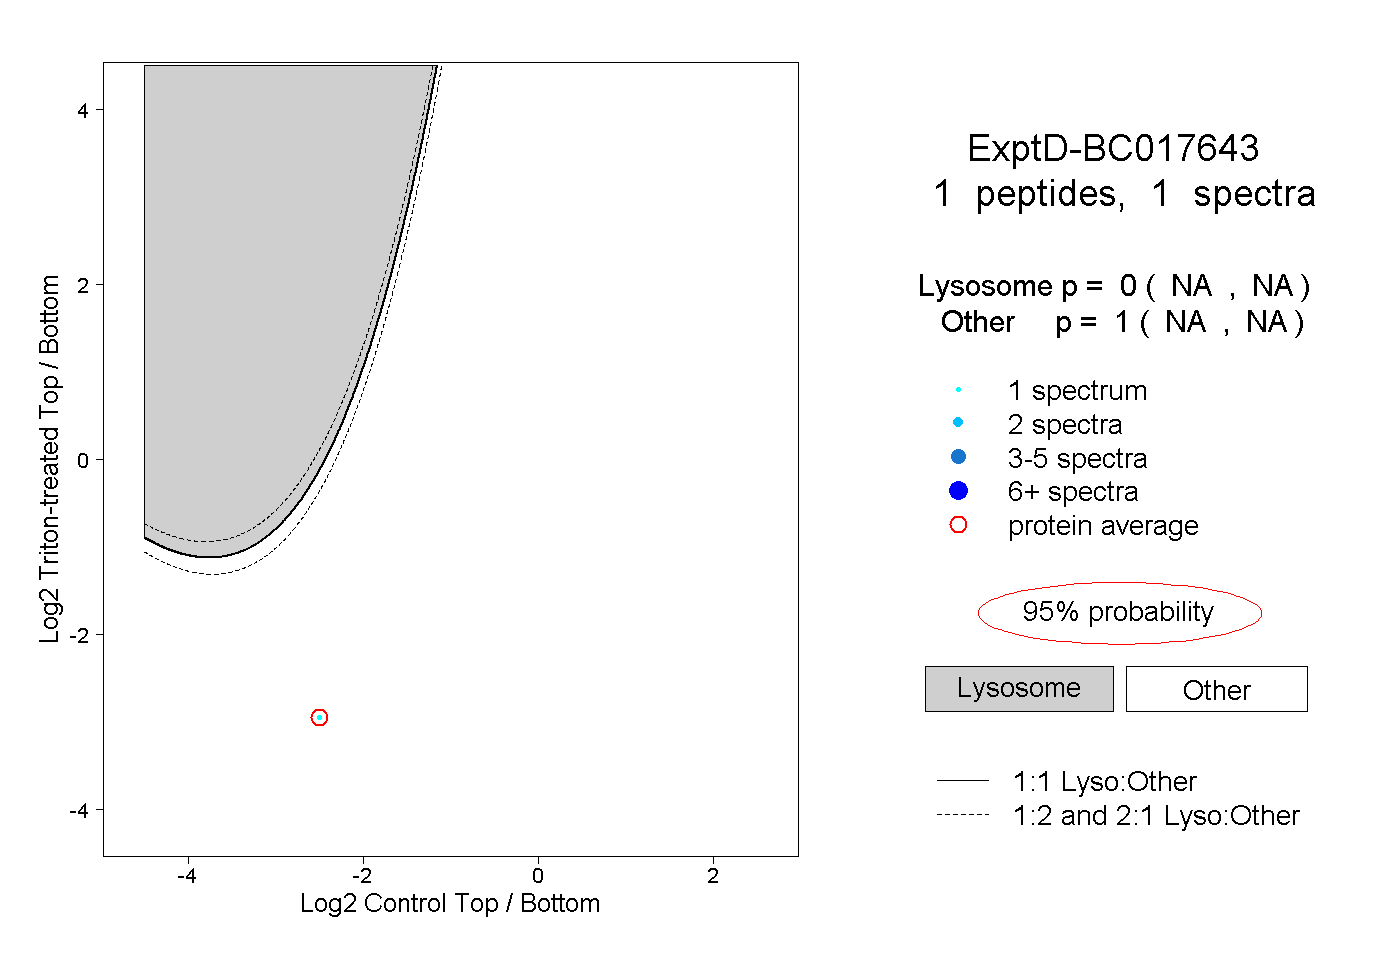 |
0.000 NA | NA |
1.000 NA | NA |