 25
25peptides
spectra
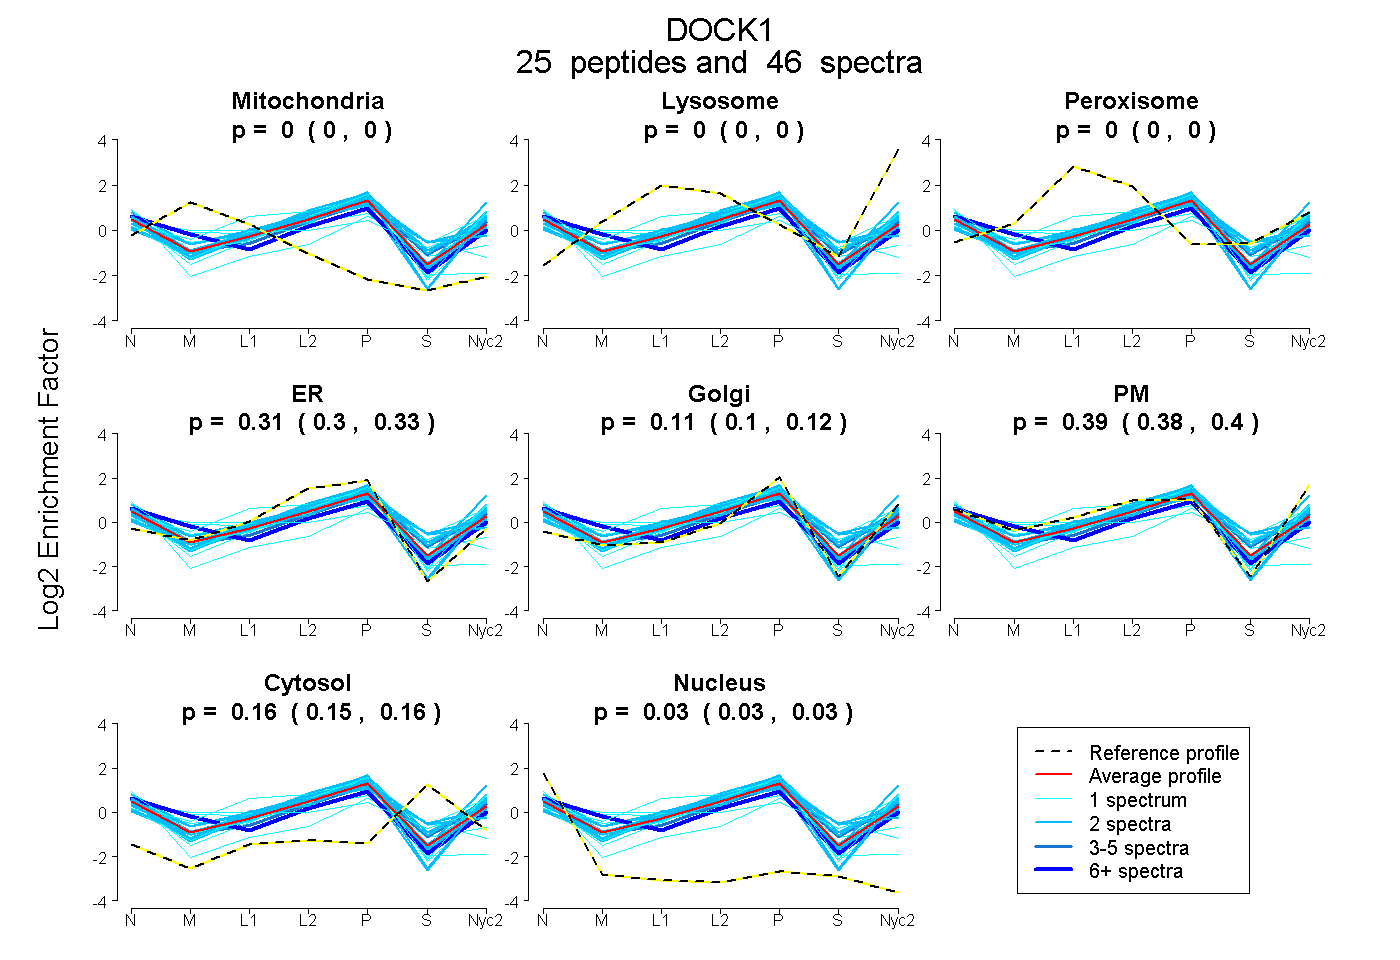
0.000 | 0.000
0.000 | 0.000
0.000 | 0.000
0.296 | 0.325
0.097 | 0.119
0.380 | 0.403
0.149 | 0.161
0.026 | 0.034
5peptides
spectra
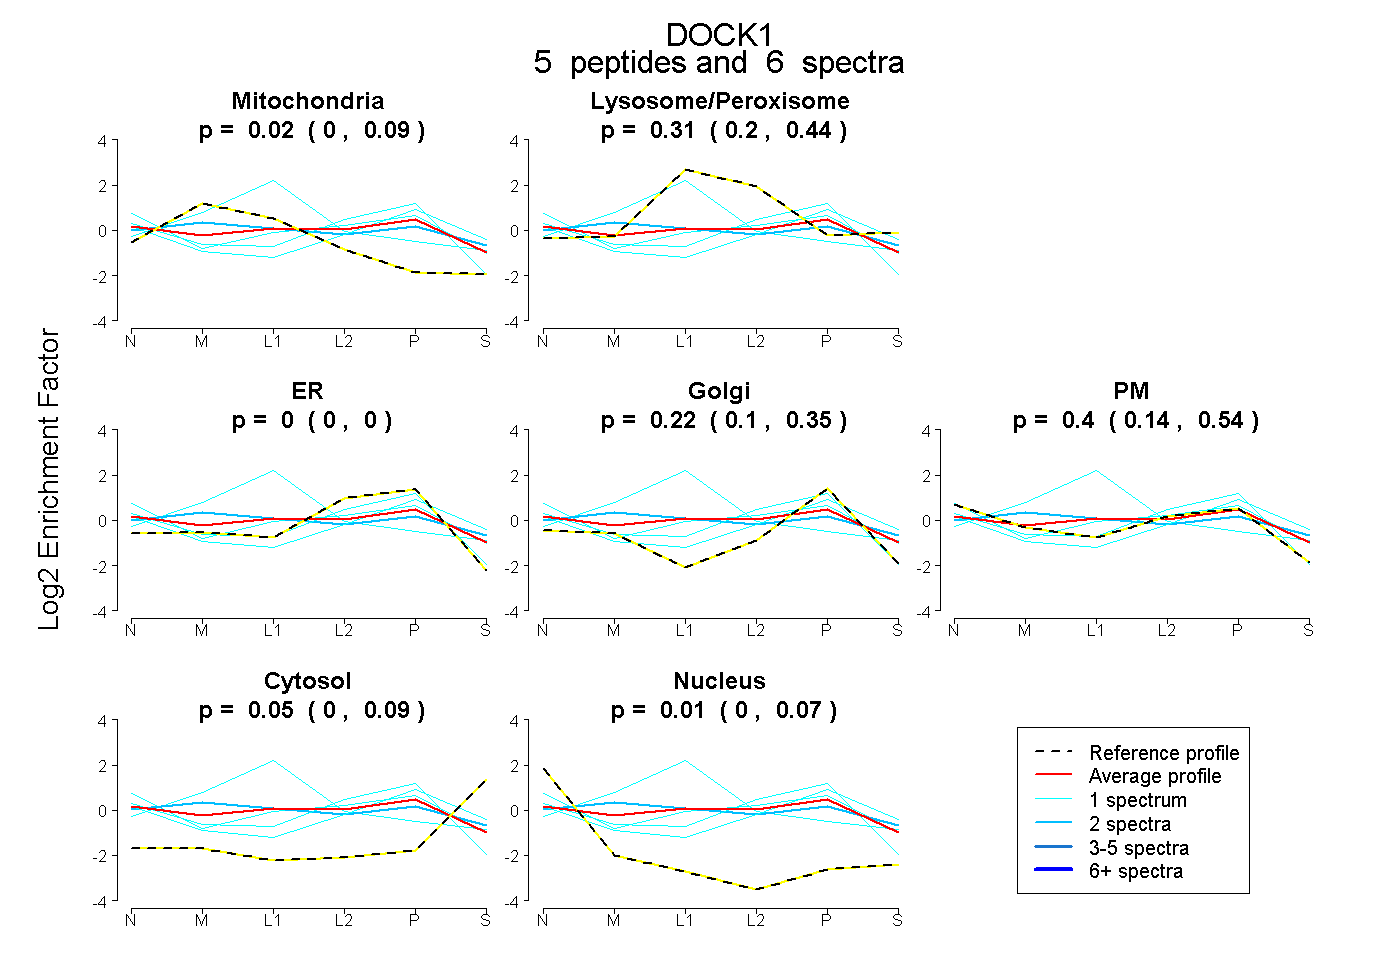
0.000 | 0.086
0.203 | 0.436
0.000 | 0.000
0.102 | 0.351
0.138 | 0.536
0.000 | 0.095
0.000 | 0.071
26peptides
spectra
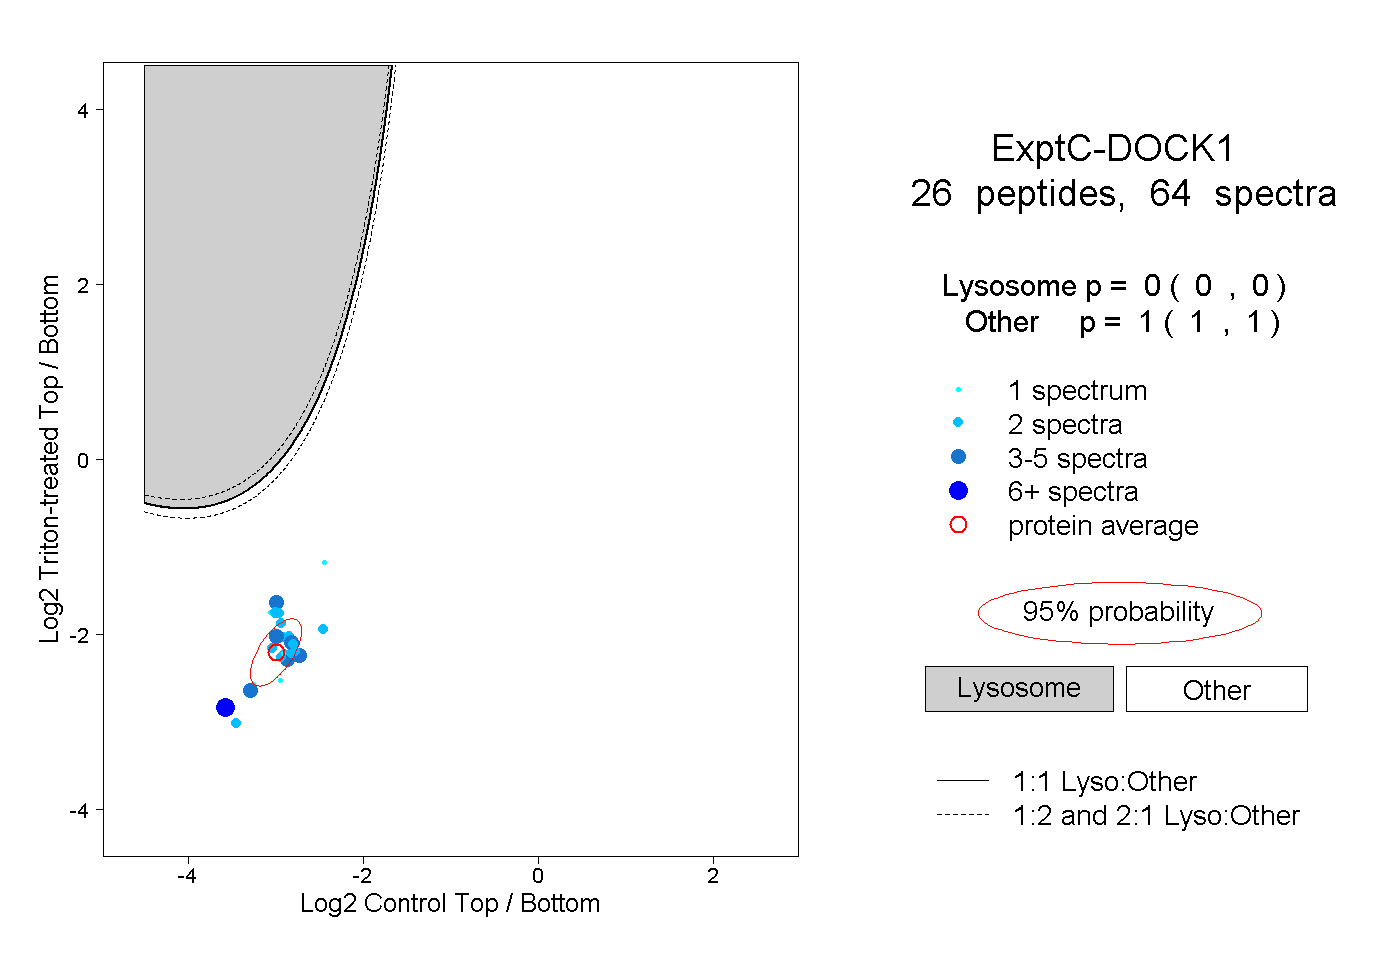
0.000 | 0.000
1.000 | 1.000
2peptides
spectra
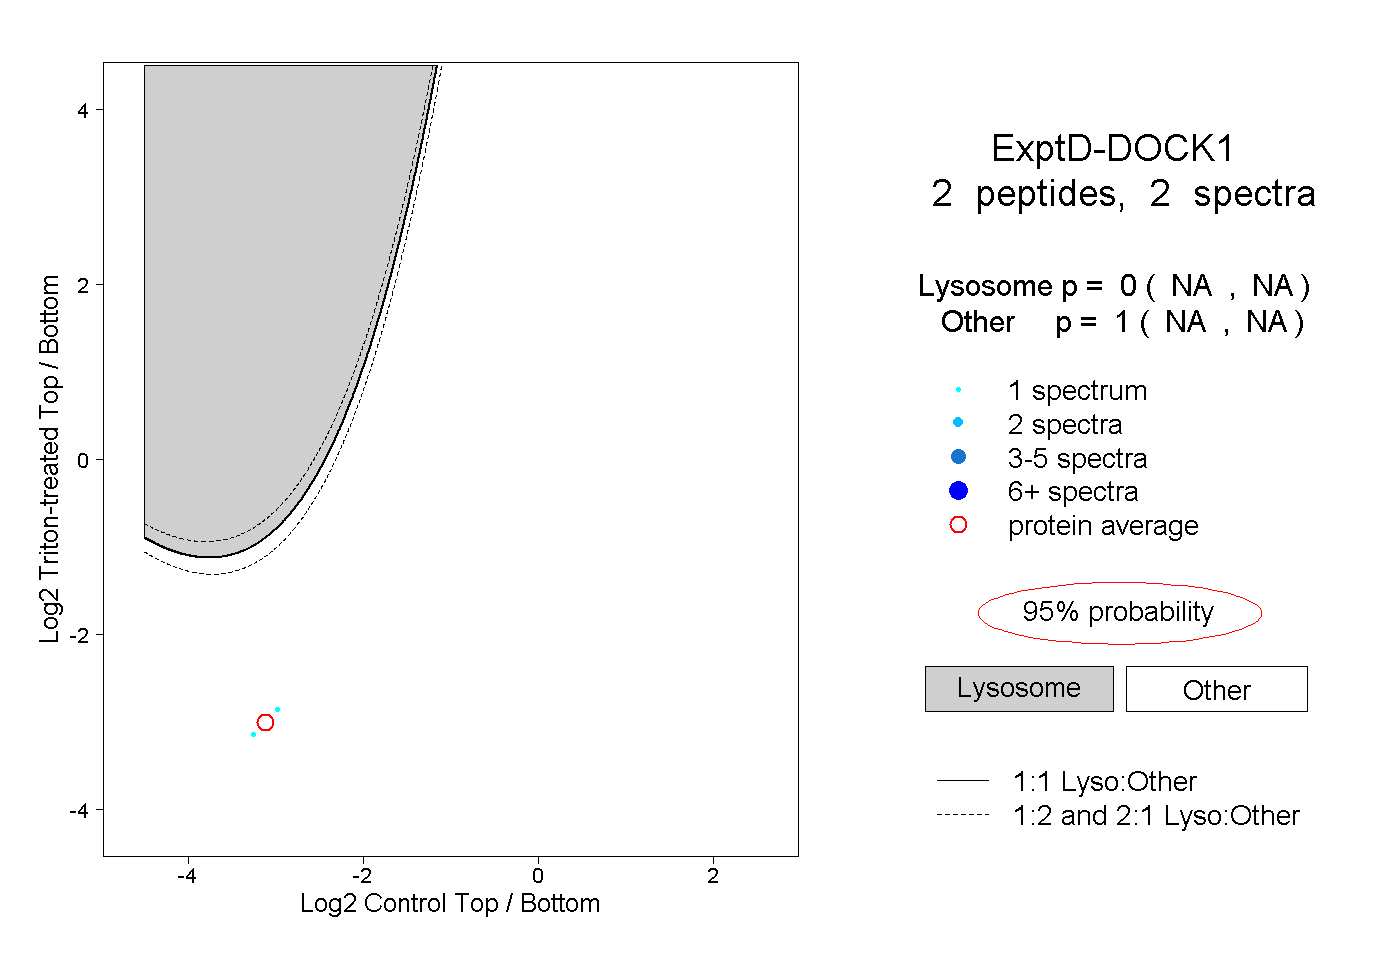
NA | NA
NA | NA