 25
25peptides
spectra
0.000 | 0.000
0.000 | 0.000
0.000 | 0.000
0.296 | 0.325
0.097 | 0.119
0.380 | 0.403
0.149 | 0.161
0.026 | 0.034
| Plot | Mito | Lyso | Perox | ER | Golgi | PM | Cytosol | Nucleus | |||||
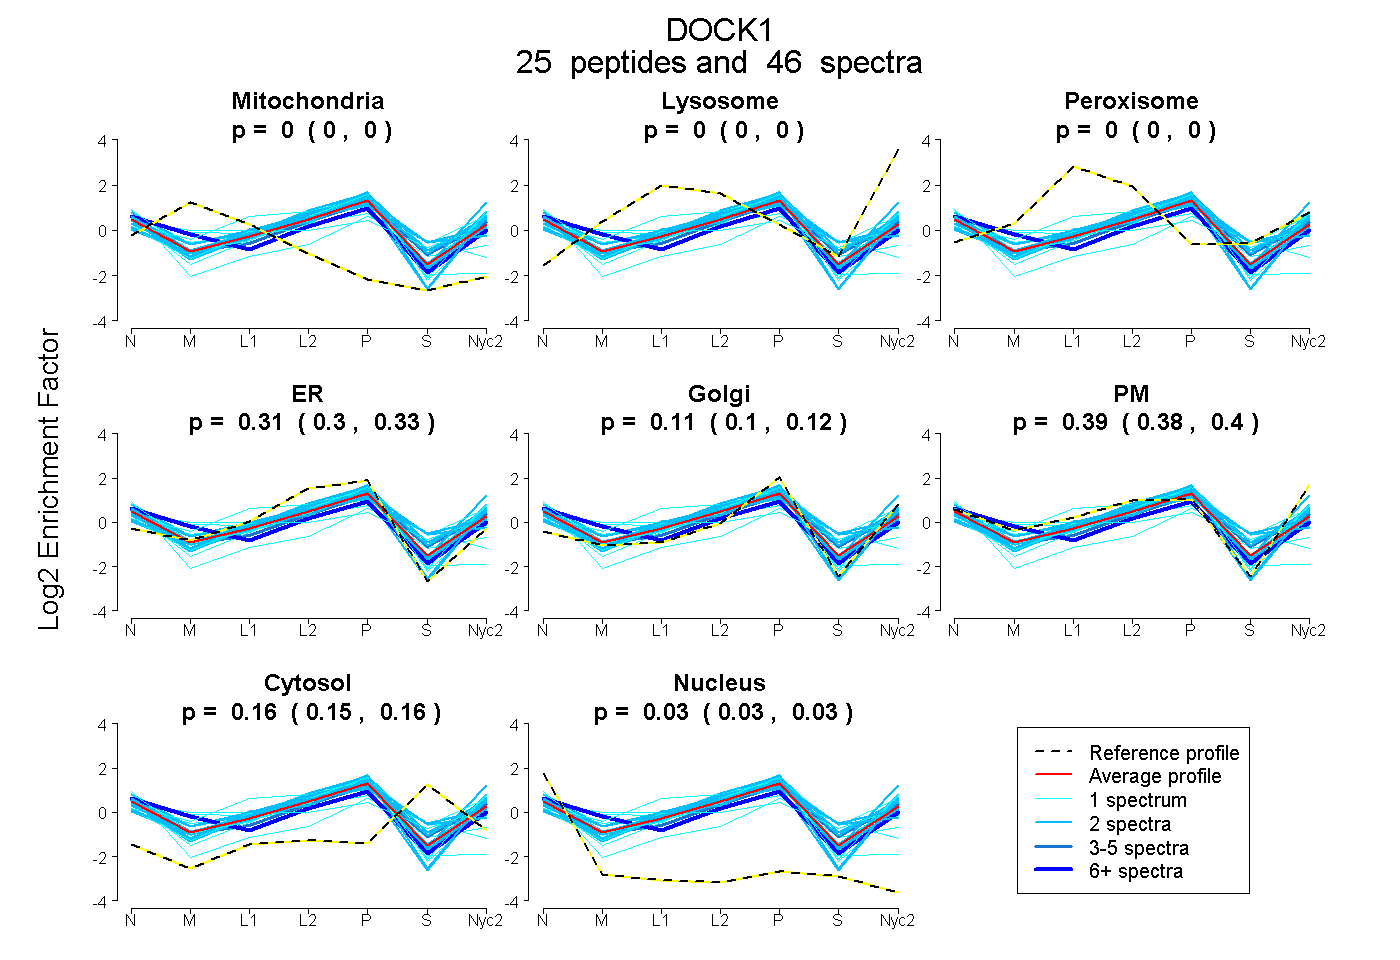
| Expt A |
25 peptides |
46 spectra |
|
0.000 0.000 | 0.000 |
0.000 0.000 | 0.000 |
0.000 0.000 | 0.000 |
0.312 0.296 | 0.325 |
0.108 0.097 | 0.119 |
0.393 0.380 | 0.403 |
0.156 0.149 | 0.161 |
0.030 0.026 | 0.034 |
| 1 spectrum, TVISMGR | 0.000 | 0.000 | 0.253 | 0.150 | 0.325 | 0.272 | 0.000 | 0.000 | ||
| 2 spectra, AFFTDR | 0.000 | 0.000 | 0.000 | 0.258 | 0.225 | 0.408 | 0.074 | 0.035 | ||
| 1 spectrum, GMQSLGSCTISK | 0.000 | 0.000 | 0.000 | 0.312 | 0.104 | 0.034 | 0.349 | 0.200 | ||
| 2 spectra, WSEDACAAHLIQR | 0.000 | 0.000 | 0.071 | 0.307 | 0.000 | 0.330 | 0.292 | 0.000 | ||
| 2 spectra, YLPTIVNDVK | 0.000 | 0.000 | 0.040 | 0.316 | 0.203 | 0.293 | 0.093 | 0.055 | ||
| 2 spectra, DVGPTQR | 0.000 | 0.000 | 0.000 | 0.220 | 0.081 | 0.507 | 0.149 | 0.043 | ||
| 2 spectra, VNEVQR | 0.000 | 0.000 | 0.060 | 0.529 | 0.000 | 0.124 | 0.287 | 0.000 | ||
| 1 spectrum, ALEYLFK | 0.000 | 0.000 | 0.000 | 0.297 | 0.379 | 0.233 | 0.000 | 0.091 | ||
| 2 spectra, FISENYLVR | 0.000 | 0.000 | 0.000 | 0.276 | 0.000 | 0.637 | 0.000 | 0.087 | ||
| 4 spectra, EWSTIWR | 0.000 | 0.000 | 0.000 | 0.189 | 0.154 | 0.416 | 0.223 | 0.018 | ||
| 2 spectra, LLTQFPNAEK | 0.000 | 0.000 | 0.000 | 0.280 | 0.068 | 0.442 | 0.211 | 0.000 | ||
| 2 spectra, SNTNLLQQNLR | 0.000 | 0.000 | 0.000 | 0.263 | 0.234 | 0.444 | 0.000 | 0.059 | ||
| 1 spectrum, AVFTDLGSK | 0.185 | 0.000 | 0.119 | 0.144 | 0.357 | 0.158 | 0.012 | 0.026 | ||
| 2 spectra, EFPHLVDR | 0.000 | 0.000 | 0.000 | 0.137 | 0.315 | 0.413 | 0.108 | 0.027 | ||
| 1 spectrum, HMIYDLIEWR | 0.016 | 0.000 | 0.073 | 0.087 | 0.530 | 0.288 | 0.000 | 0.007 | ||
| 2 spectra, EILLPMMTDQLK | 0.000 | 0.000 | 0.097 | 0.155 | 0.430 | 0.139 | 0.179 | 0.000 | ||
| 2 spectra, QLYVQDNR | 0.000 | 0.000 | 0.007 | 0.274 | 0.080 | 0.496 | 0.137 | 0.007 | ||
| 1 spectrum, ISFVCQIVR | 0.000 | 0.000 | 0.000 | 0.781 | 0.000 | 0.000 | 0.025 | 0.195 | ||
| 1 spectrum, SFQMFENEIITK | 0.000 | 0.000 | 0.121 | 0.000 | 0.000 | 0.542 | 0.238 | 0.099 | ||
| 6 spectra, QNMDINR | 0.110 | 0.000 | 0.000 | 0.140 | 0.256 | 0.365 | 0.043 | 0.087 | ||
| 2 spectra, NPDNEFANMWIER | 0.000 | 0.000 | 0.000 | 0.110 | 0.215 | 0.579 | 0.095 | 0.000 | ||
| 1 spectrum, DGEHDLIVYK | 0.173 | 0.000 | 0.050 | 0.399 | 0.000 | 0.189 | 0.166 | 0.024 | ||
| 1 spectrum, VTEALRPFHER | 0.000 | 0.000 | 0.000 | 0.155 | 0.327 | 0.459 | 0.026 | 0.033 | ||
| 1 spectrum, SINDMMSSMSELTVR | 0.000 | 0.000 | 0.082 | 0.171 | 0.225 | 0.291 | 0.231 | 0.000 | ||
| 2 spectra, LPGILR | 0.000 | 0.000 | 0.000 | 0.204 | 0.296 | 0.415 | 0.085 | 0.000 |
| Plot | Mito | Lyso or Perox | ER | Golgi | PM | Cytosol | Nucleus | ||||||
| Expt B |
5 peptides |
6 spectra |
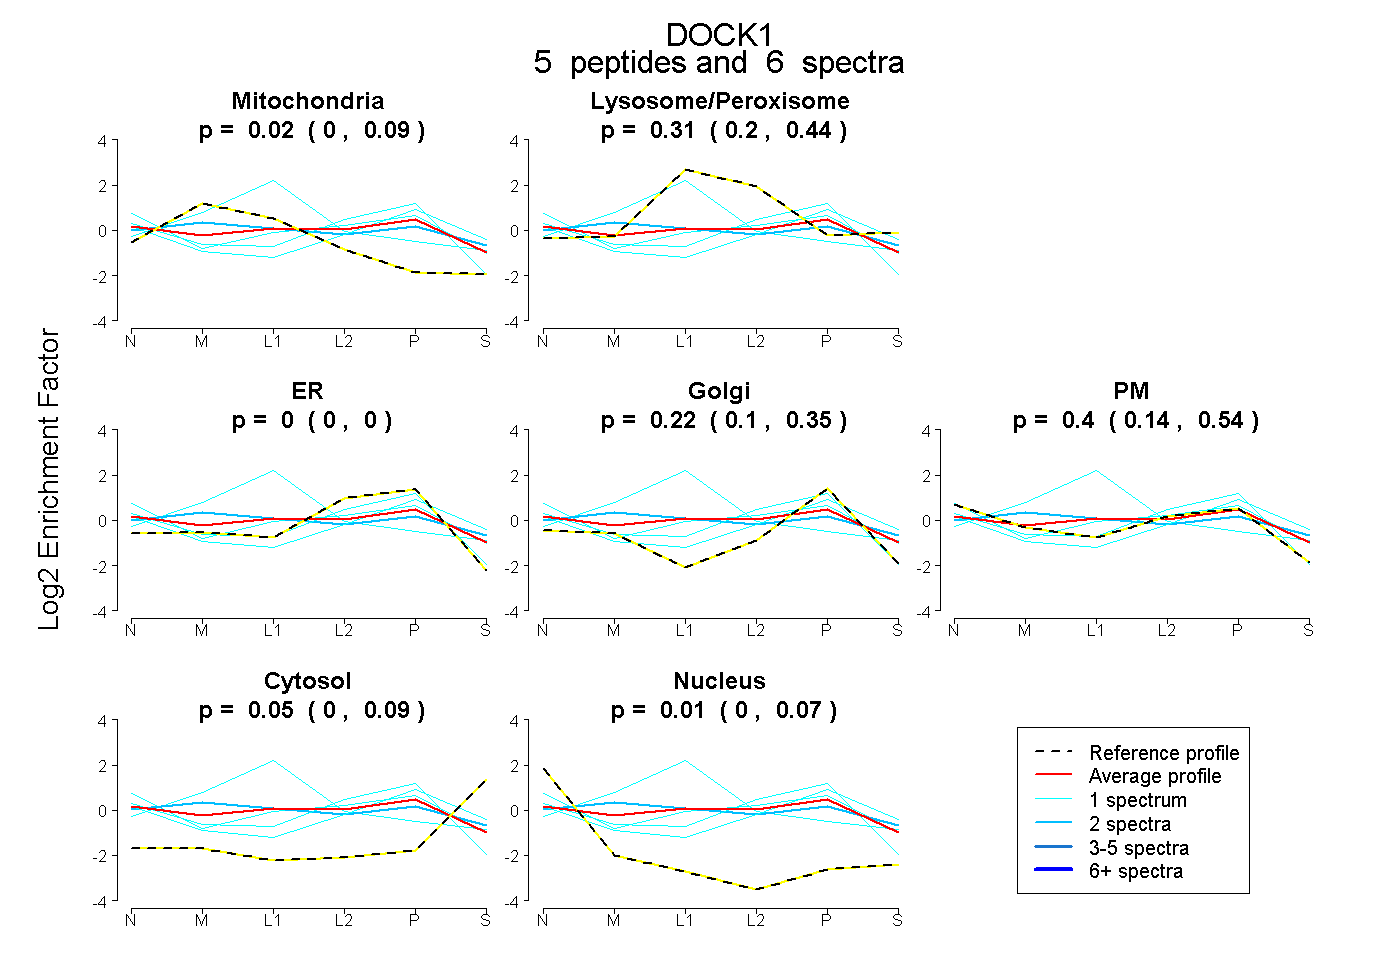 |
0.021 0.000 | 0.086 |
0.307 0.203 | 0.436 |
0.000 0.000 | 0.000 |
0.222 0.102 | 0.351 |
0.395 0.138 | 0.536 |
0.047 0.000 | 0.095 |
0.008 0.000 | 0.071 |
|||
| Plot | Lyso | Other | |||||||||||
| Expt C |
26 peptides |
64 spectra |
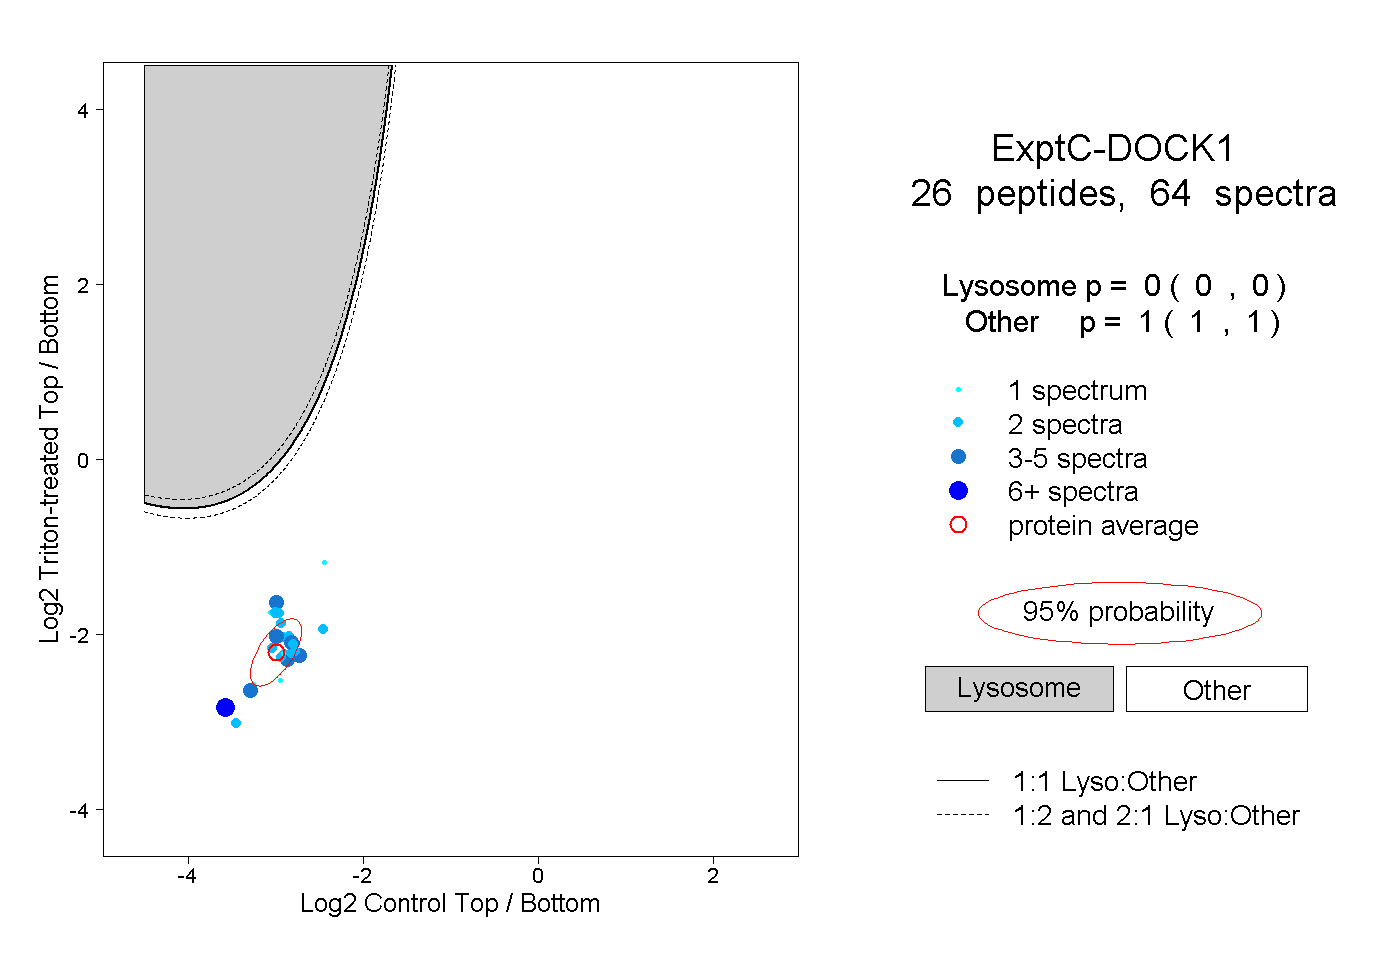 |
0.000 0.000 | 0.000 |
1.000 1.000 | 1.000 |
||||||||
| Plot | Lyso | Other | |||||||||||
| Expt D |
2 peptides |
2 spectra |
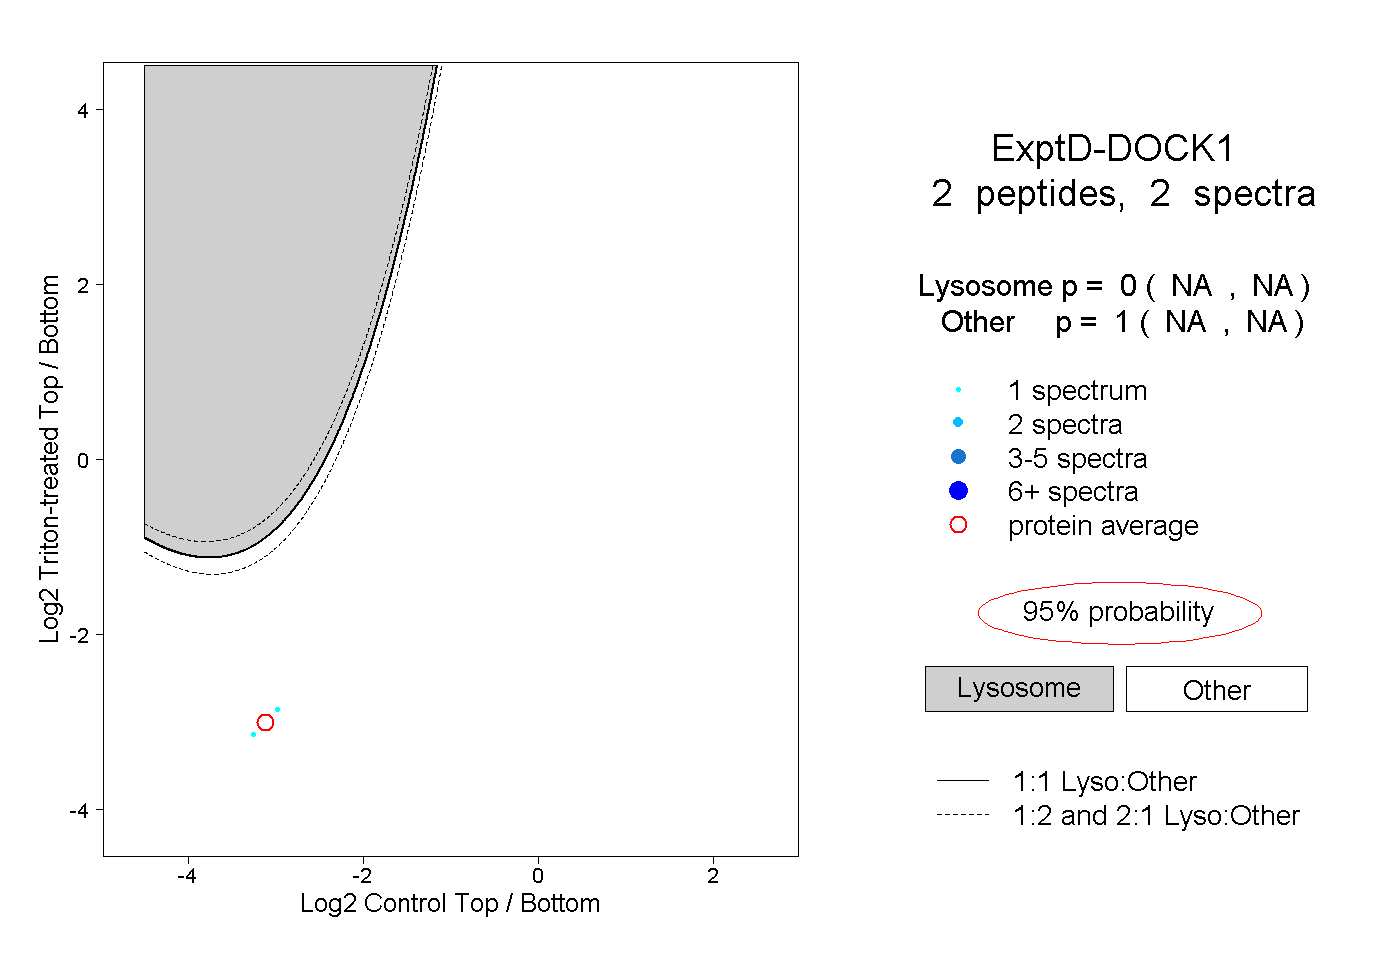 |
0.000 NA | NA |
1.000 NA | NA |