 8
8peptides
spectra
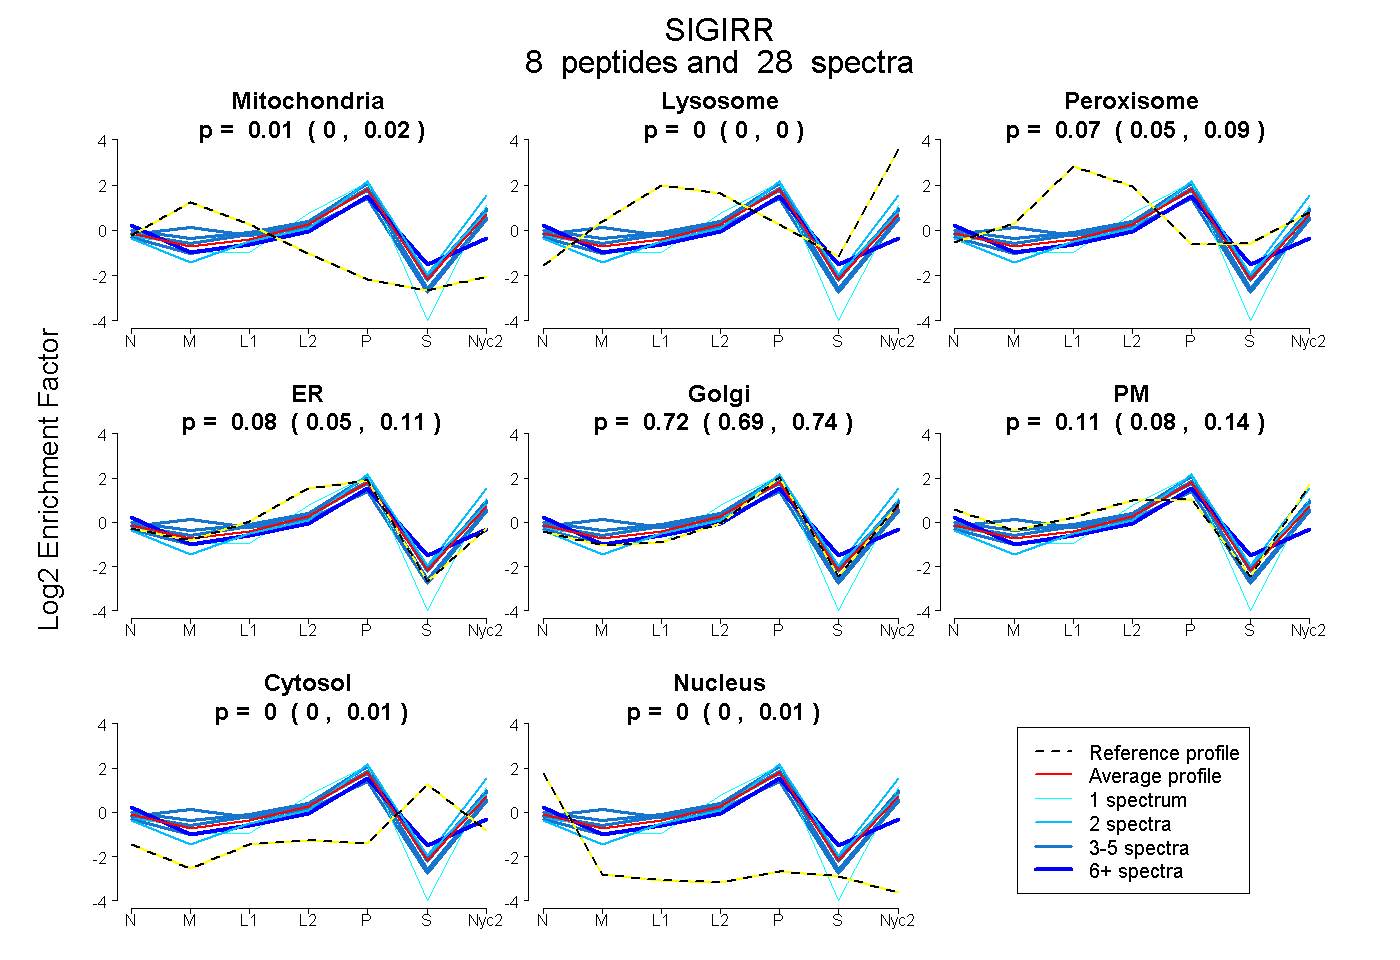
0.000 | 0.021
0.000 | 0.000
0.052 | 0.092
0.048 | 0.110
0.686 | 0.745
0.076 | 0.141
0.000 | 0.006
0.000 | 0.009
3peptides
spectra
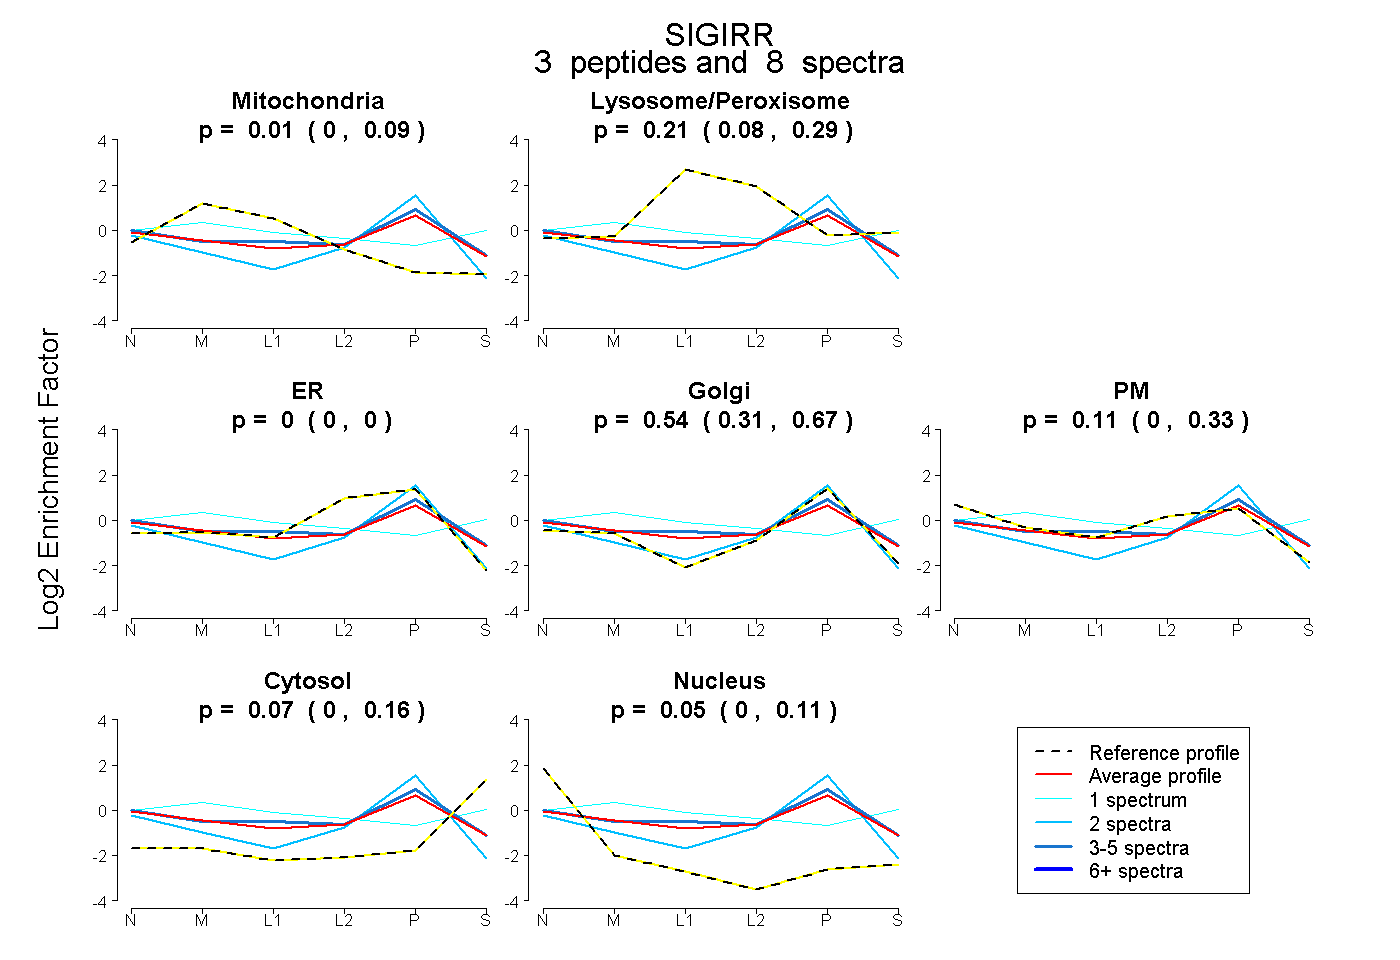
0.000 | 0.091
0.083 | 0.286
0.000 | 0.000
0.315 | 0.667
0.000 | 0.330
0.000 | 0.159
0.000 | 0.106
7peptides
spectra
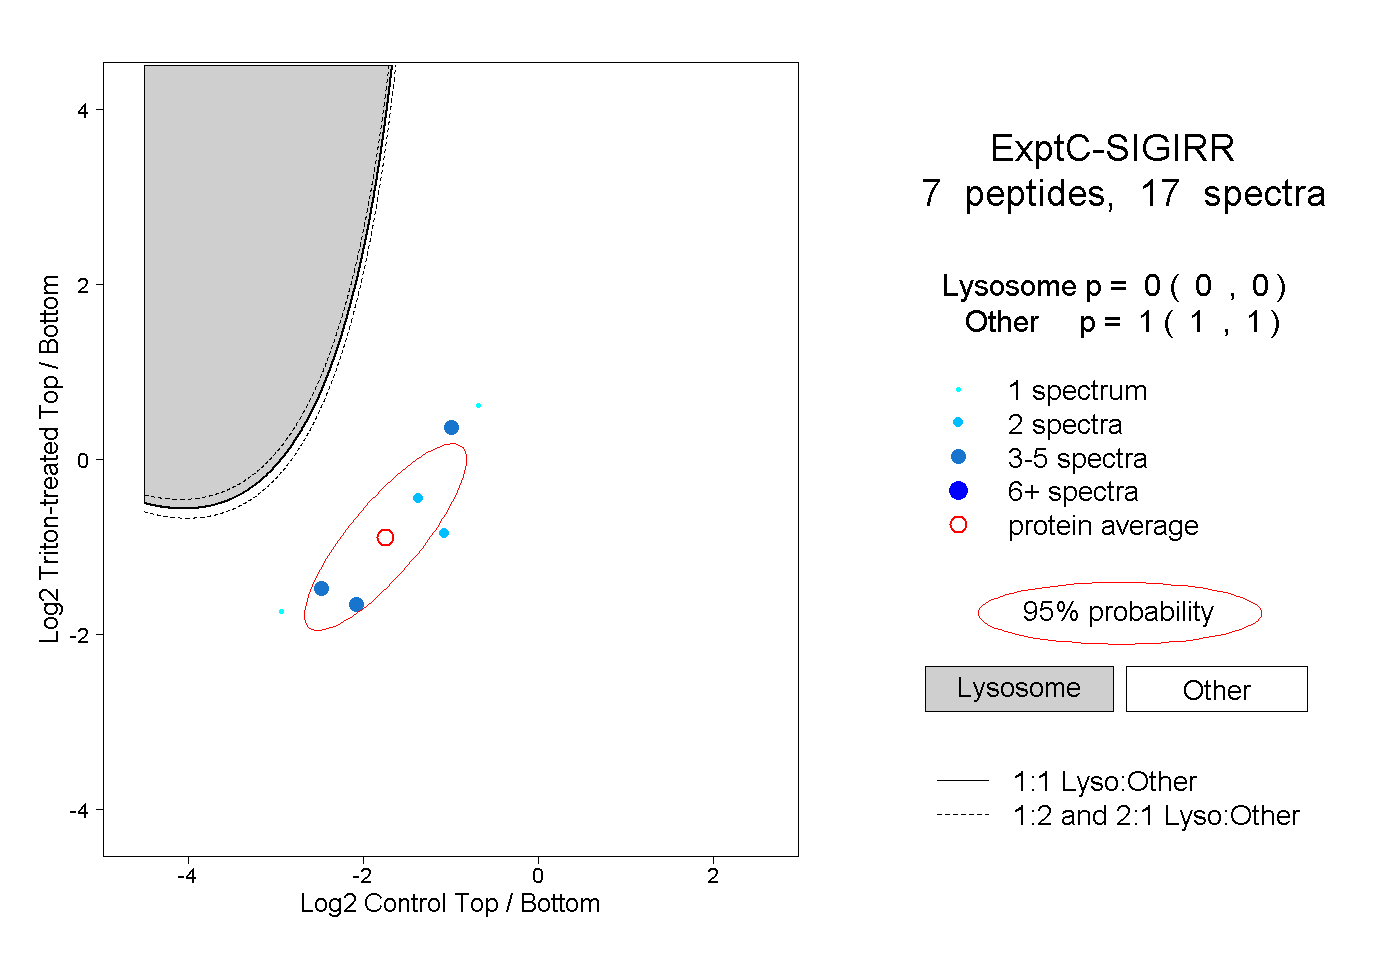
0.000 | 0.000
1.000 | 1.000
1peptide
spectra
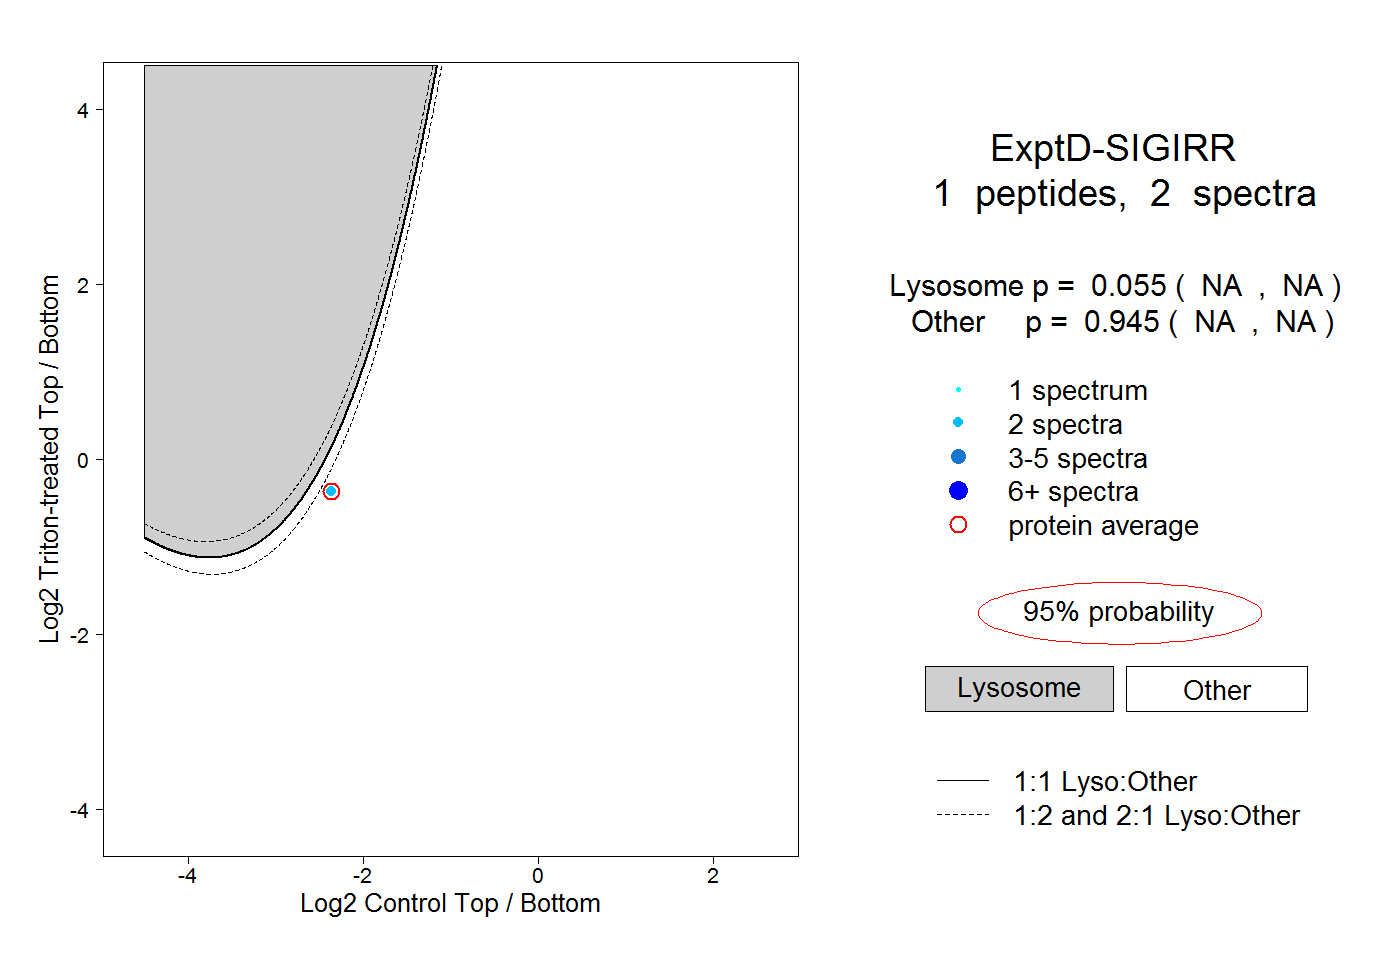
NA | NA
NA | NA