 8
8peptides
spectra
0.000 | 0.021
0.000 | 0.000
0.052 | 0.092
0.048 | 0.110
0.686 | 0.745
0.076 | 0.141
0.000 | 0.006
0.000 | 0.009
| Plot | Mito | Lyso | Perox | ER | Golgi | PM | Cytosol | Nucleus | |||||
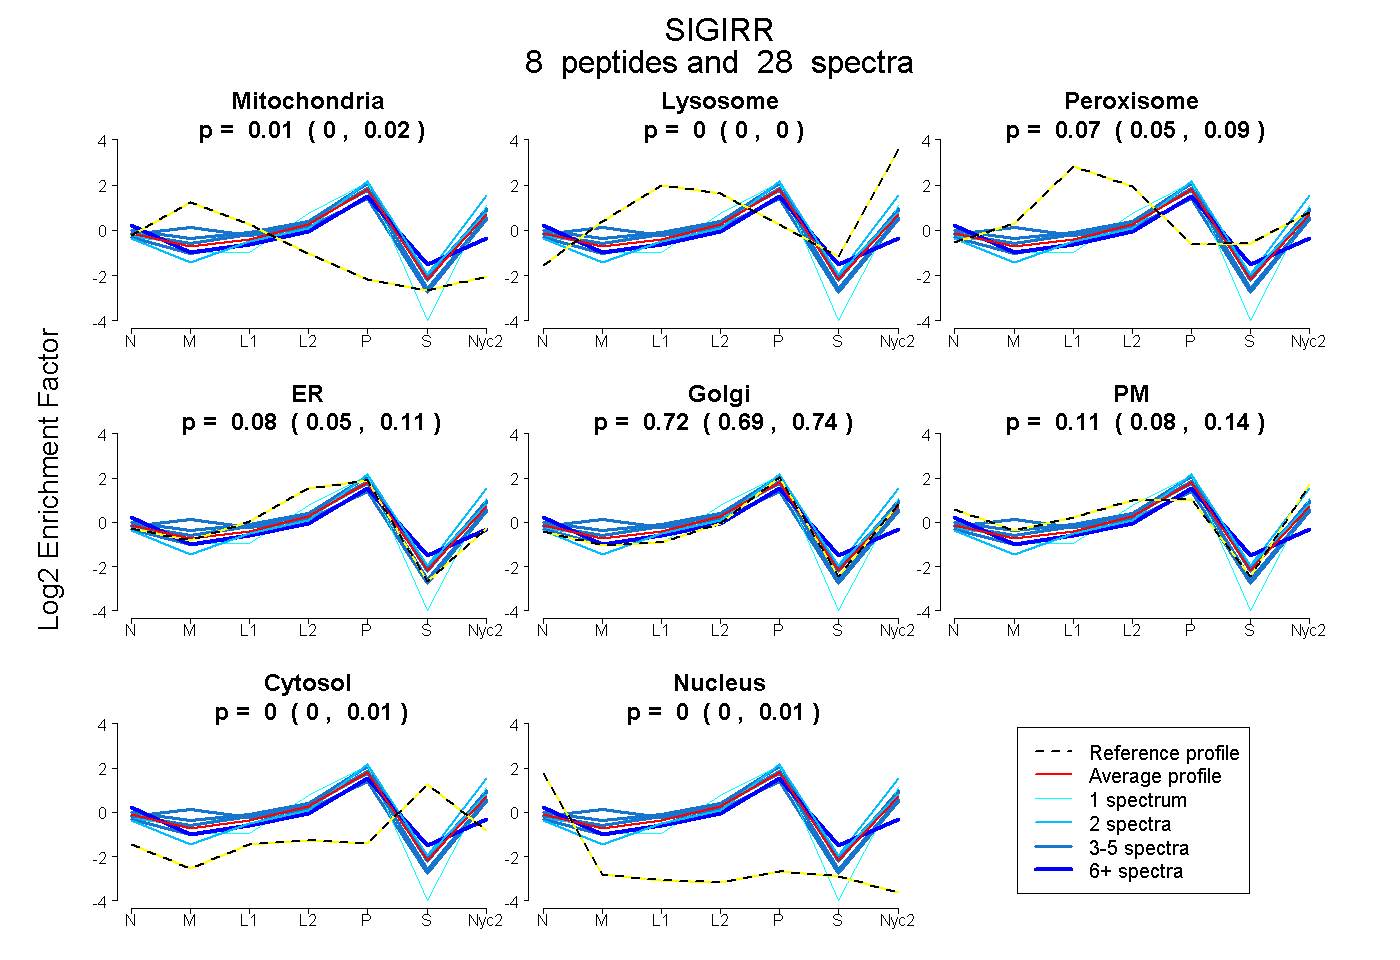
| Expt A |
8 peptides |
28 spectra |
|
0.011 0.000 | 0.021 |
0.000 0.000 | 0.000 |
0.074 0.052 | 0.092 |
0.080 0.048 | 0.110 |
0.722 0.686 | 0.745 |
0.111 0.076 | 0.141 |
0.000 0.000 | 0.006 |
0.001 0.000 | 0.009 |
| 3 spectra, LYDAYVSYSDRPEDR | 0.000 | 0.000 | 0.118 | 0.032 | 0.705 | 0.145 | 0.000 | 0.000 | ||
| 1 spectrum, FVNFILKPQLER | 0.000 | 0.000 | 0.000 | 0.196 | 0.618 | 0.186 | 0.000 | 0.000 | ||
| 9 spectra, RPWCSQSFR | 0.000 | 0.000 | 0.039 | 0.323 | 0.434 | 0.000 | 0.124 | 0.080 | ||
| 4 spectra, RPIFITFEGQR | 0.061 | 0.000 | 0.000 | 0.247 | 0.407 | 0.285 | 0.000 | 0.000 | ||
| 2 spectra, AEPSADLLVNLSR | 0.000 | 0.184 | 0.000 | 0.000 | 0.644 | 0.172 | 0.000 | 0.000 | ||
| 4 spectra, ELQLALPR | 0.000 | 0.053 | 0.000 | 0.112 | 0.778 | 0.057 | 0.000 | 0.000 | ||
| 3 spectra, EPIHPALR | 0.172 | 0.011 | 0.000 | 0.110 | 0.467 | 0.241 | 0.000 | 0.000 | ||
| 2 spectra, VQYRPVEGDPQTR | 0.000 | 0.013 | 0.025 | 0.053 | 0.863 | 0.000 | 0.045 | 0.000 |
| Plot | Mito | Lyso or Perox | ER | Golgi | PM | Cytosol | Nucleus | ||||||
| Expt B |
3 peptides |
8 spectra |
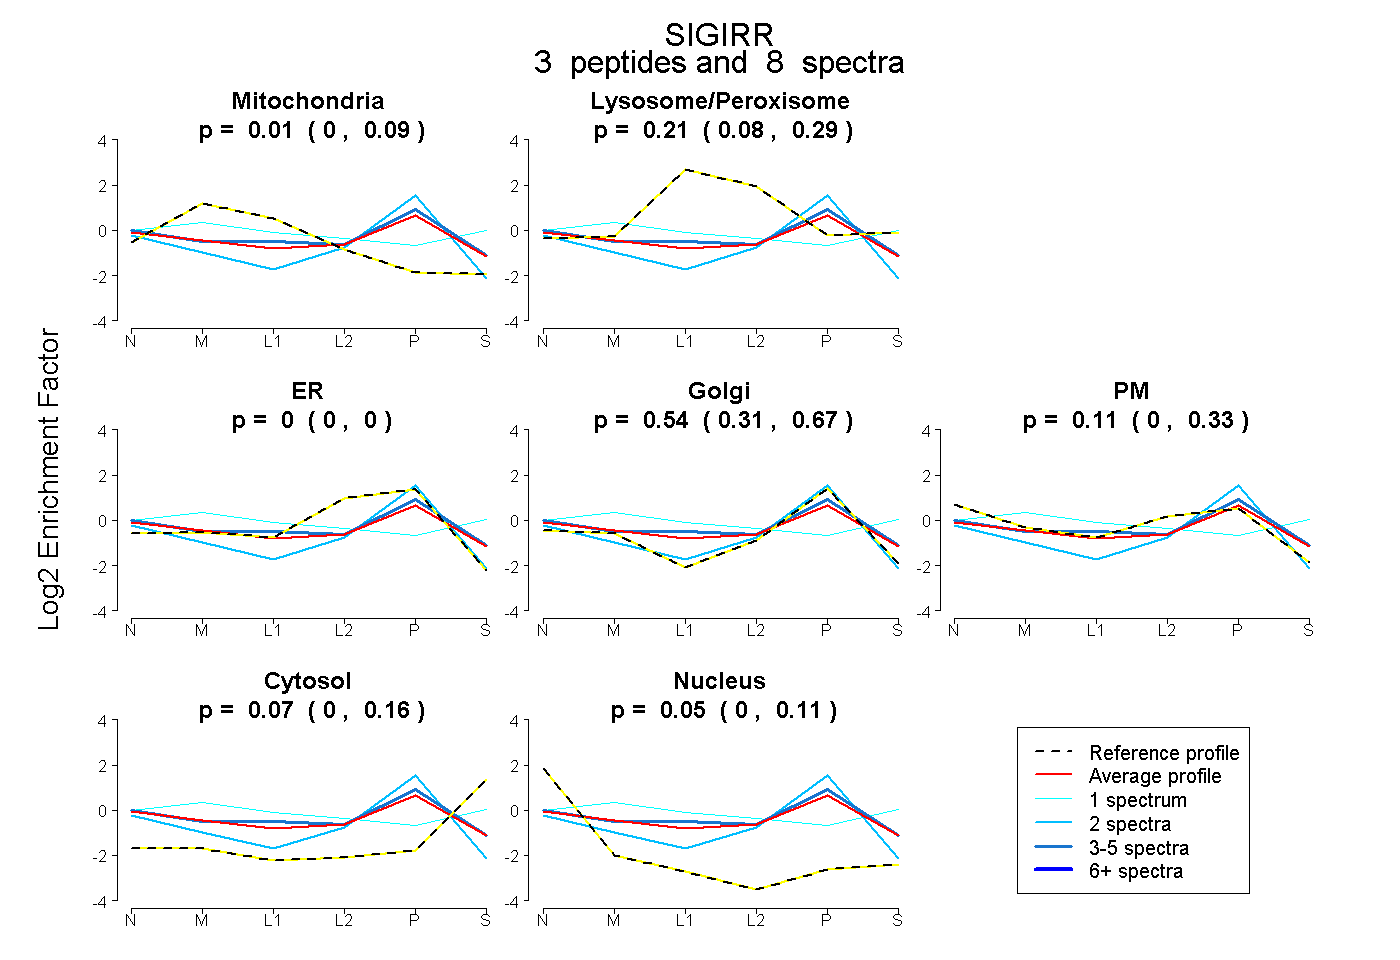 |
0.013 0.000 | 0.091 |
0.214 0.083 | 0.286 |
0.000 0.000 | 0.000 |
0.539 0.315 | 0.667 |
0.114 0.000 | 0.330 |
0.065 0.000 | 0.159 |
0.055 0.000 | 0.106 |
|||
| Plot | Lyso | Other | |||||||||||
| Expt C |
7 peptides |
17 spectra |
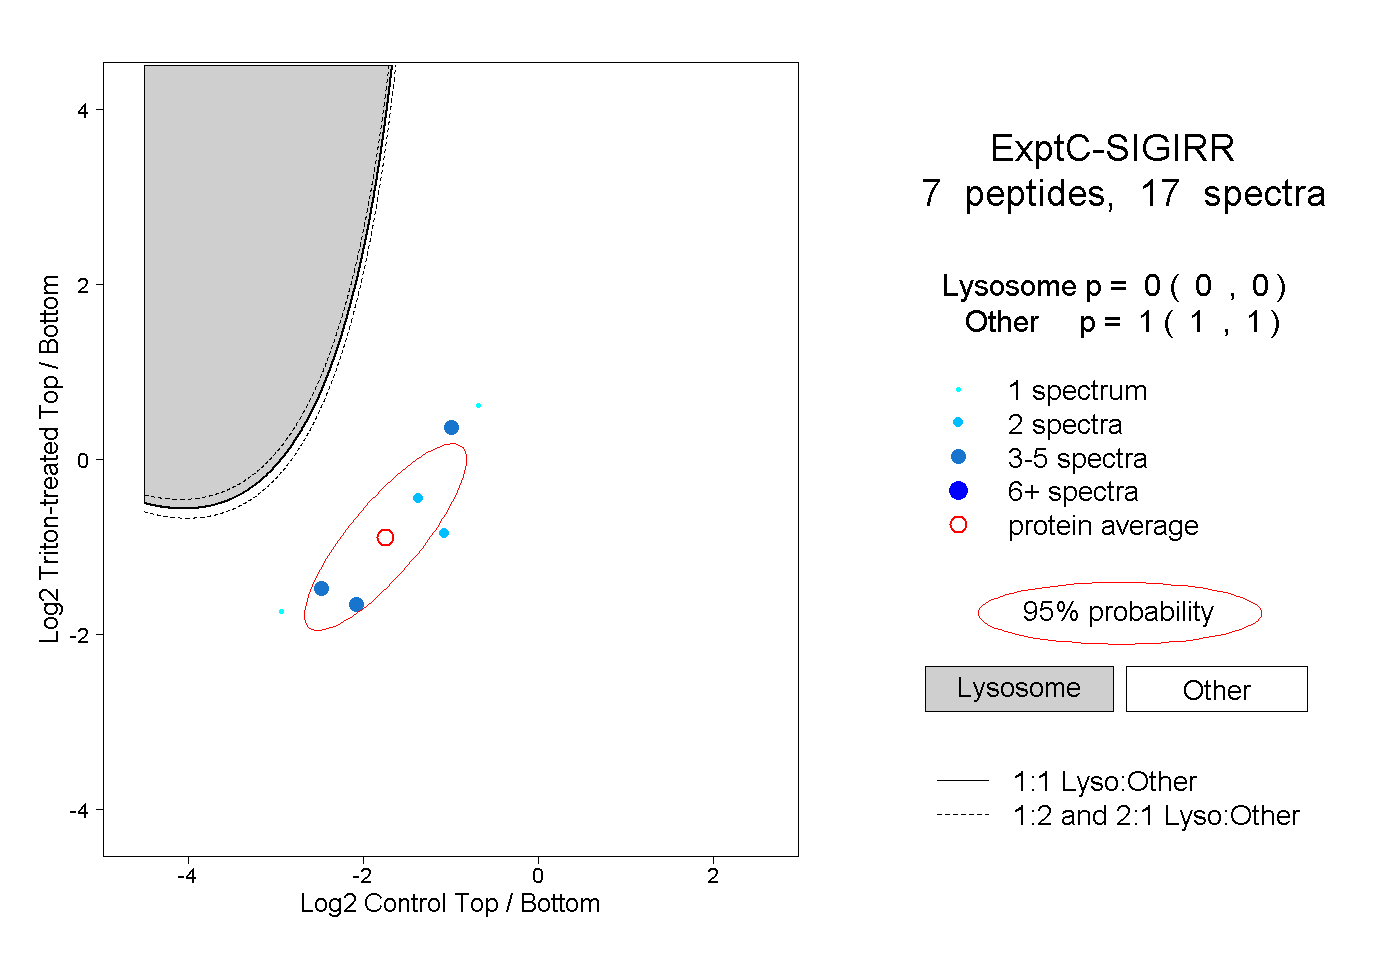 |
0.000 0.000 | 0.000 |
1.000 1.000 | 1.000 |
||||||||
| Plot | Lyso | Other | |||||||||||
| Expt D |
1 peptide |
2 spectra |
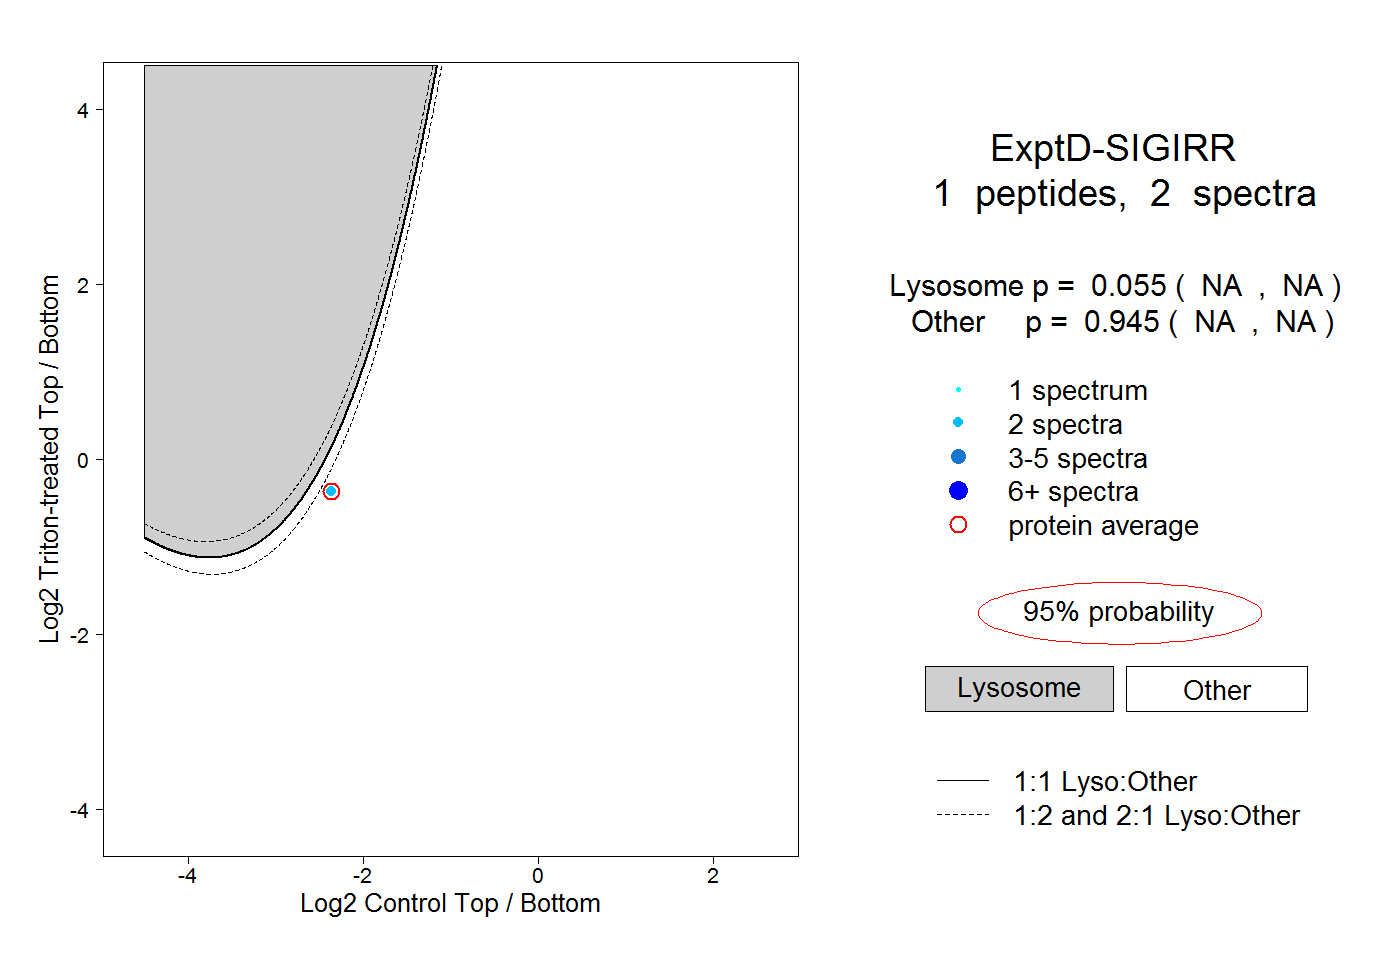 |
0.055 NA | NA |
0.945 NA | NA |