 3
3peptides
spectra
0.000 | 0.000
0.257 | 0.360
0.000 | 0.037
0.000 | 0.000
0.000 | 0.000
0.166 | 0.223
0.451 | 0.500
0.000 | 0.000
4peptides
spectra
0.000 | 0.000
1.000 | 1.000
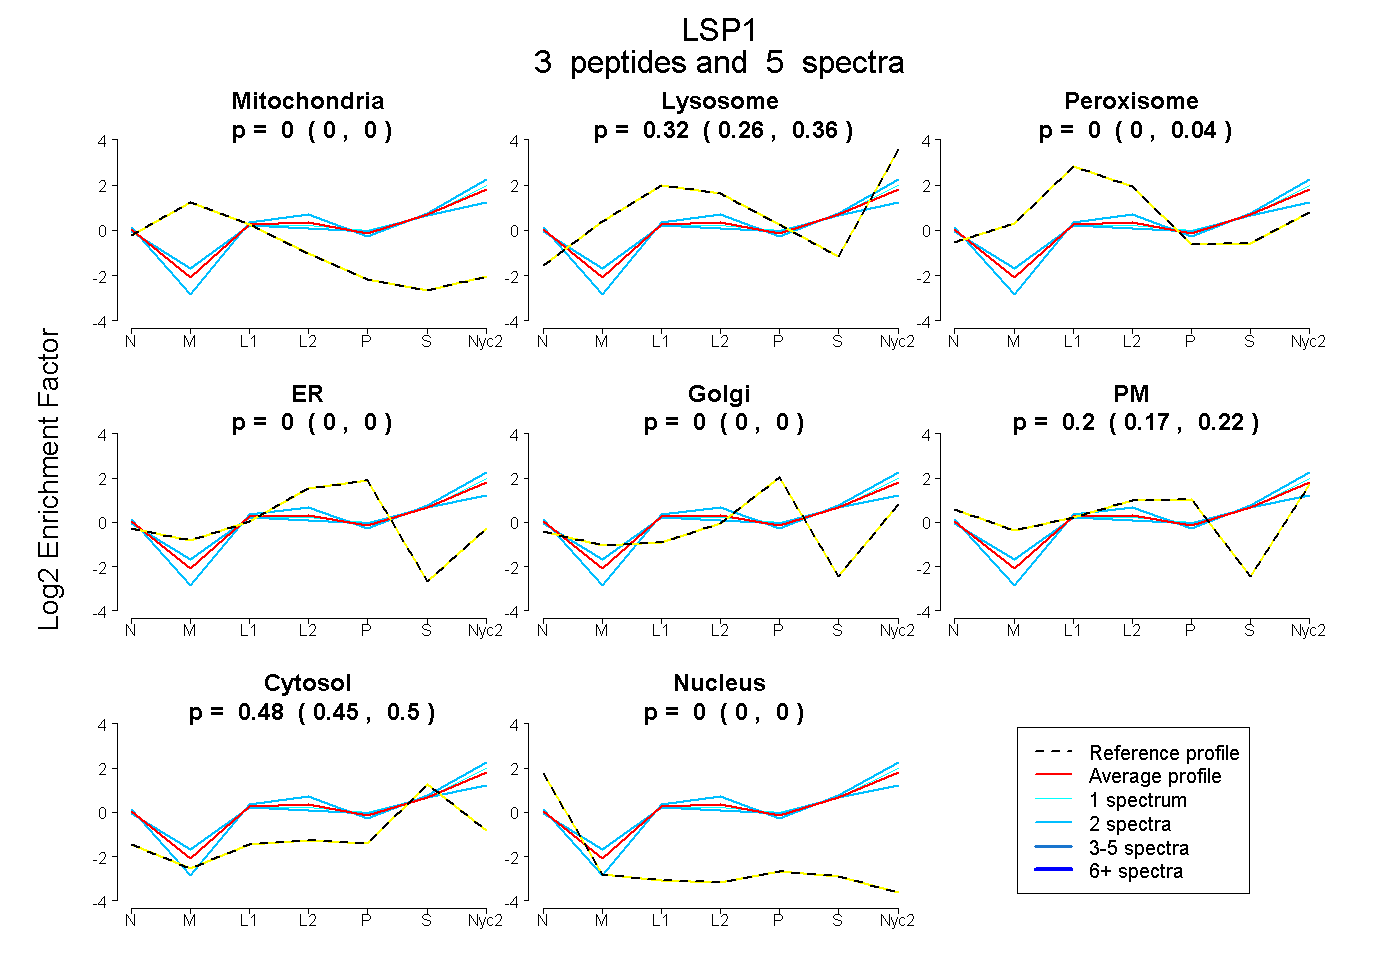
| Plot | Mito | Lyso | Perox | ER | Golgi | PM | Cytosol | Nucleus | |||||
| Expt A |
3 peptides |
5 spectra |
|
0.000 0.000 | 0.000 |
0.324 0.257 | 0.360 |
0.000 0.000 | 0.037 |
0.000 0.000 | 0.000 |
0.000 0.000 | 0.000 |
0.198 0.166 | 0.223 |
0.477 0.451 | 0.500 |
0.000 0.000 | 0.000 |
||
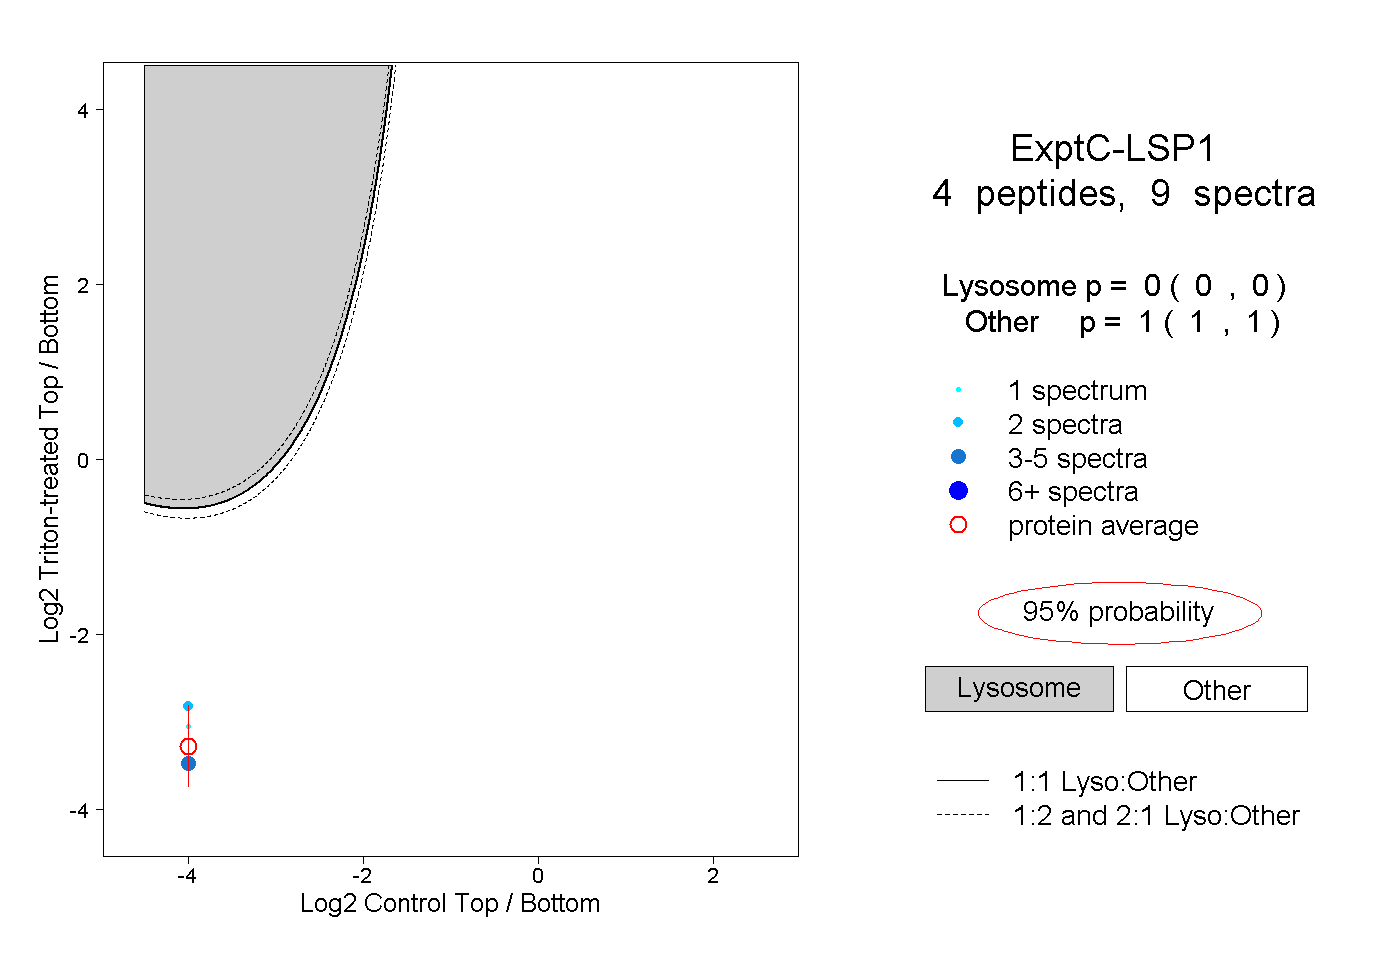
| Plot | Lyso | Other | |||||||||||
| Expt C |
4 peptides |
9 spectra |
|
0.000 0.000 | 0.000 |
1.000 1.000 | 1.000 |