 3
3peptides
spectra
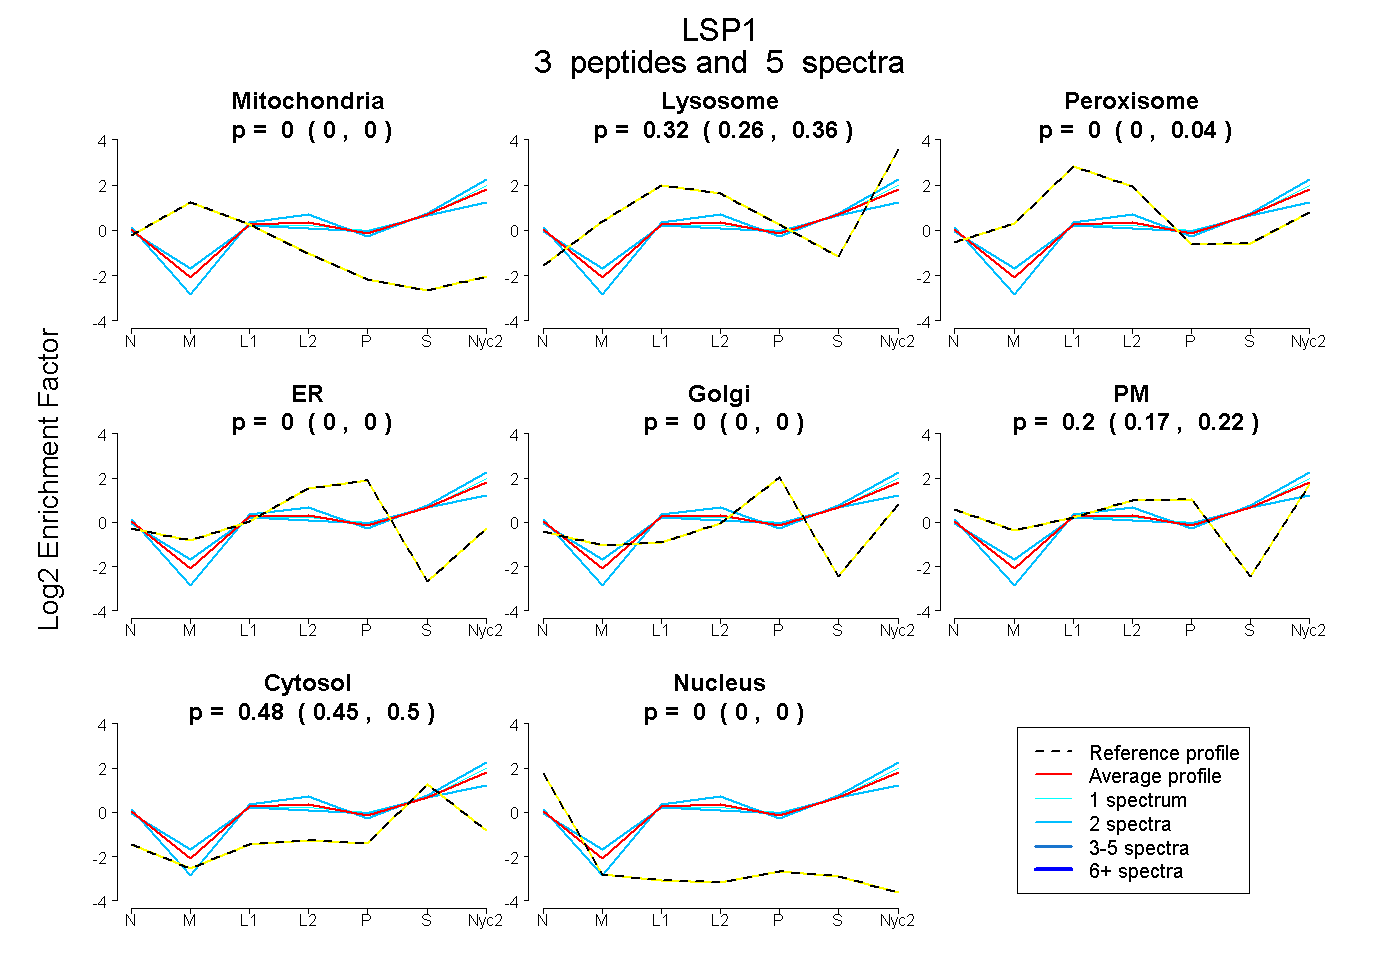
0.000 | 0.000
0.257 | 0.360
0.000 | 0.037
0.000 | 0.000
0.000 | 0.000
0.166 | 0.223
0.451 | 0.500
0.000 | 0.000
| Plot | Mito | Lyso | Perox | ER | Golgi | PM | Cytosol | Nucleus | |||||
| Expt A |
3 peptides |
5 spectra |
|
0.000 0.000 | 0.000 |
0.324 0.257 | 0.360 |
0.000 0.000 | 0.037 |
0.000 0.000 | 0.000 |
0.000 0.000 | 0.000 |
0.198 0.166 | 0.223 |
0.477 0.451 | 0.500 |
0.000 0.000 | 0.000 |
| 2 spectra, TPSCQDIVAGDMSK | 0.000 | 0.202 | 0.084 | 0.000 | 0.000 | 0.224 | 0.490 | 0.000 | ||
| 2 spectra, SQPTLPISTIDER | 0.000 | 0.362 | 0.000 | 0.000 | 0.000 | 0.160 | 0.478 | 0.000 | ||
| 1 spectrum, LQQYTQATESAGR | 0.000 | 0.344 | 0.000 | 0.000 | 0.000 | 0.210 | 0.447 | 0.000 |
| Plot | Lyso | Other | |||||||||||
| Expt C |
4 peptides |
9 spectra |
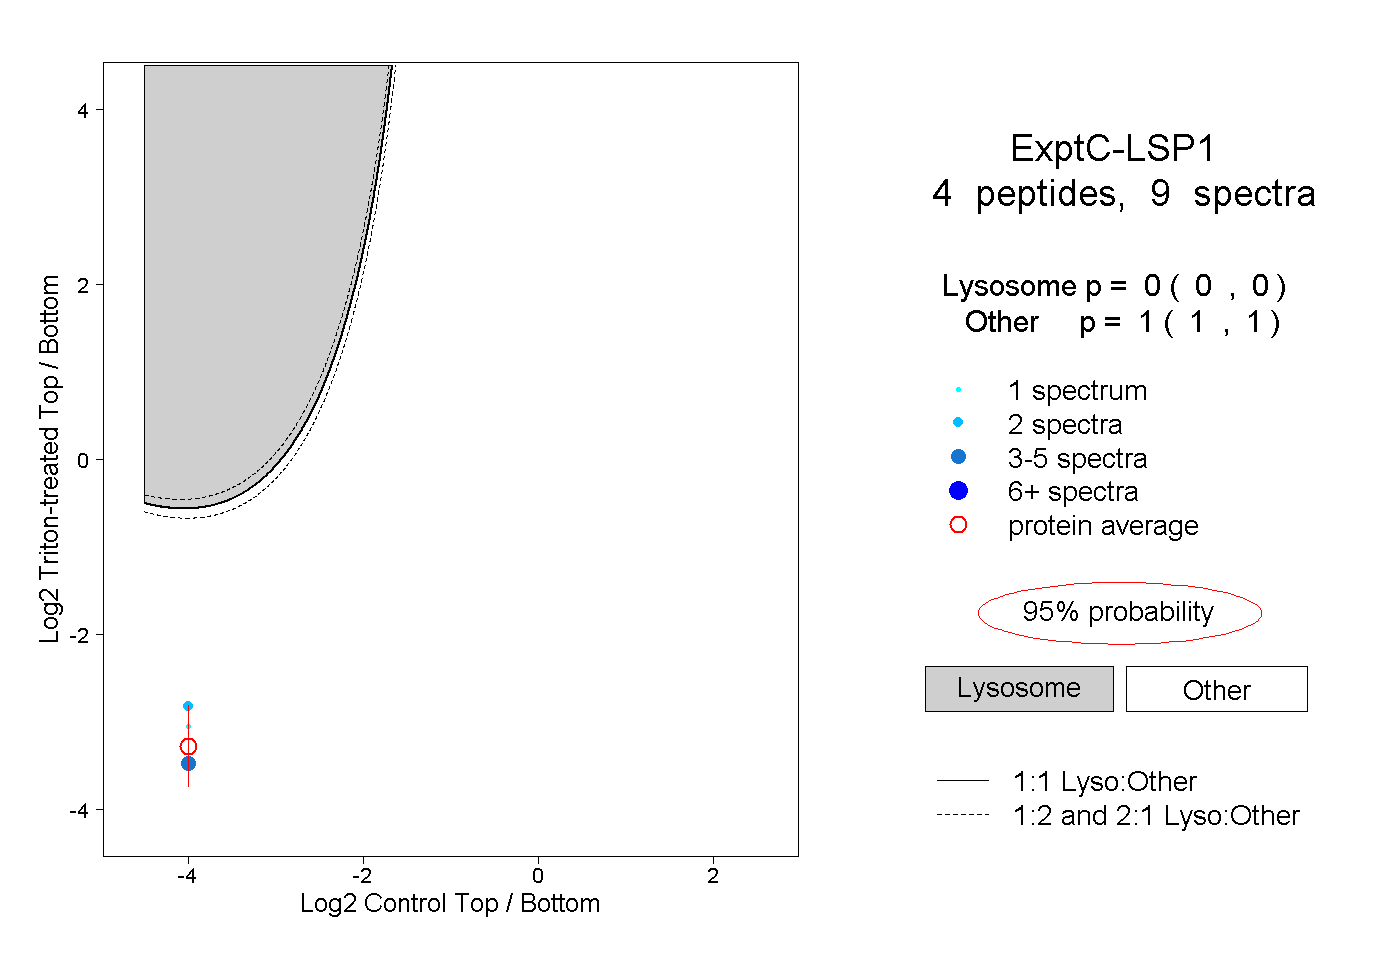 |
0.000 0.000 | 0.000 |
1.000 1.000 | 1.000 |