 9
9peptides
spectra
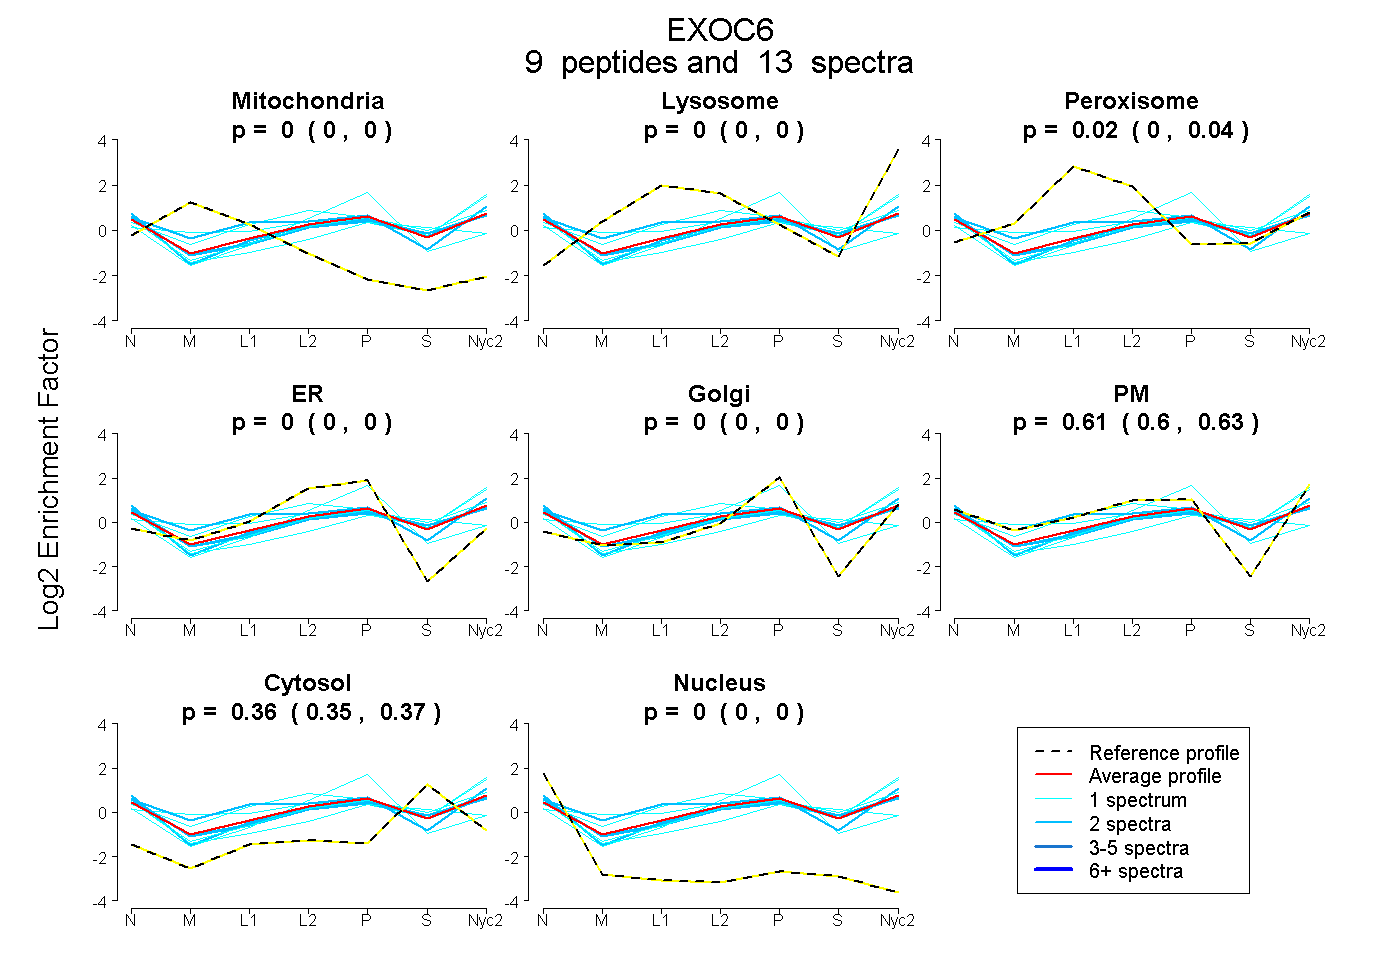
0.000 | 0.000
0.000 | 0.000
0.004 | 0.038
0.000 | 0.000
0.000 | 0.000
0.596 | 0.630
0.349 | 0.372
0.000 | 0.000
2peptides
spectra
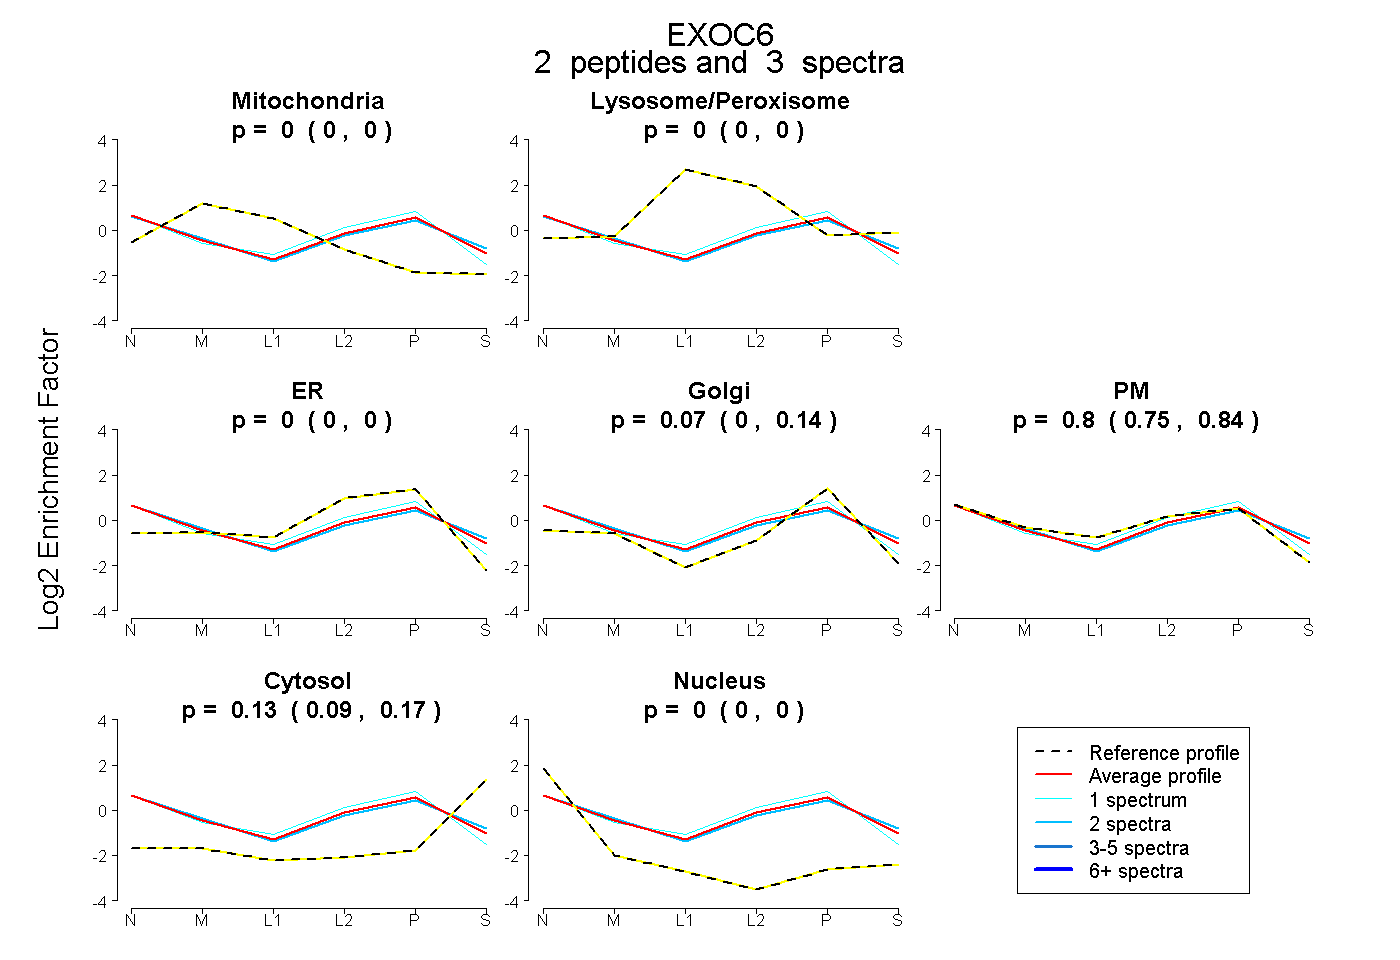
0.000 | 0.000
0.000 | 0.000
0.000 | 0.000
0.002 | 0.137
0.746 | 0.840
0.086 | 0.165
0.000 | 0.000
9peptides
spectra
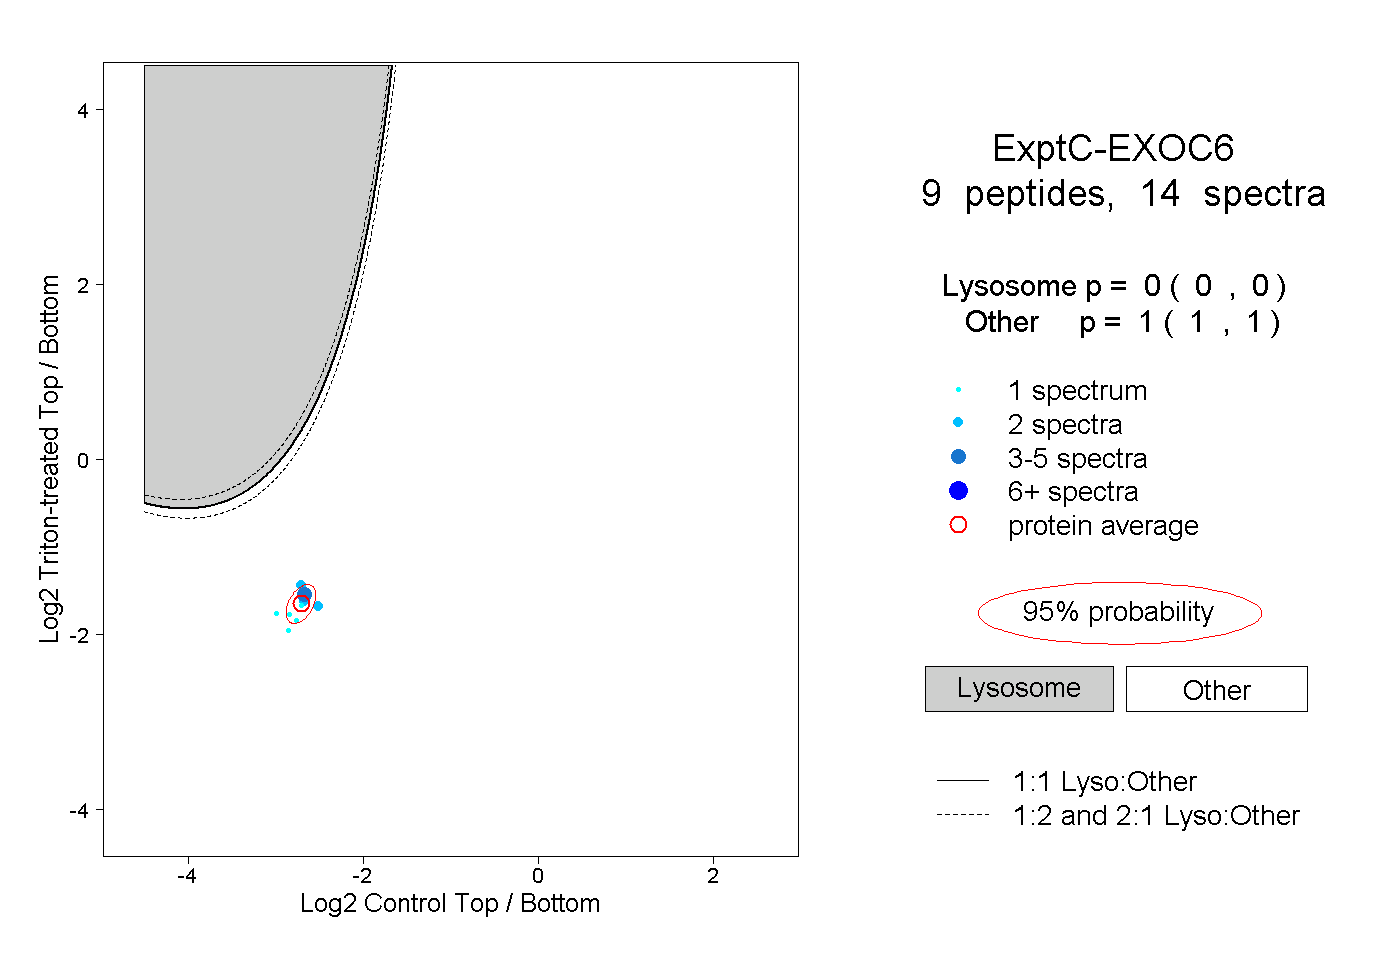
0.000 | 0.000
1.000 | 1.000
2peptides
spectra
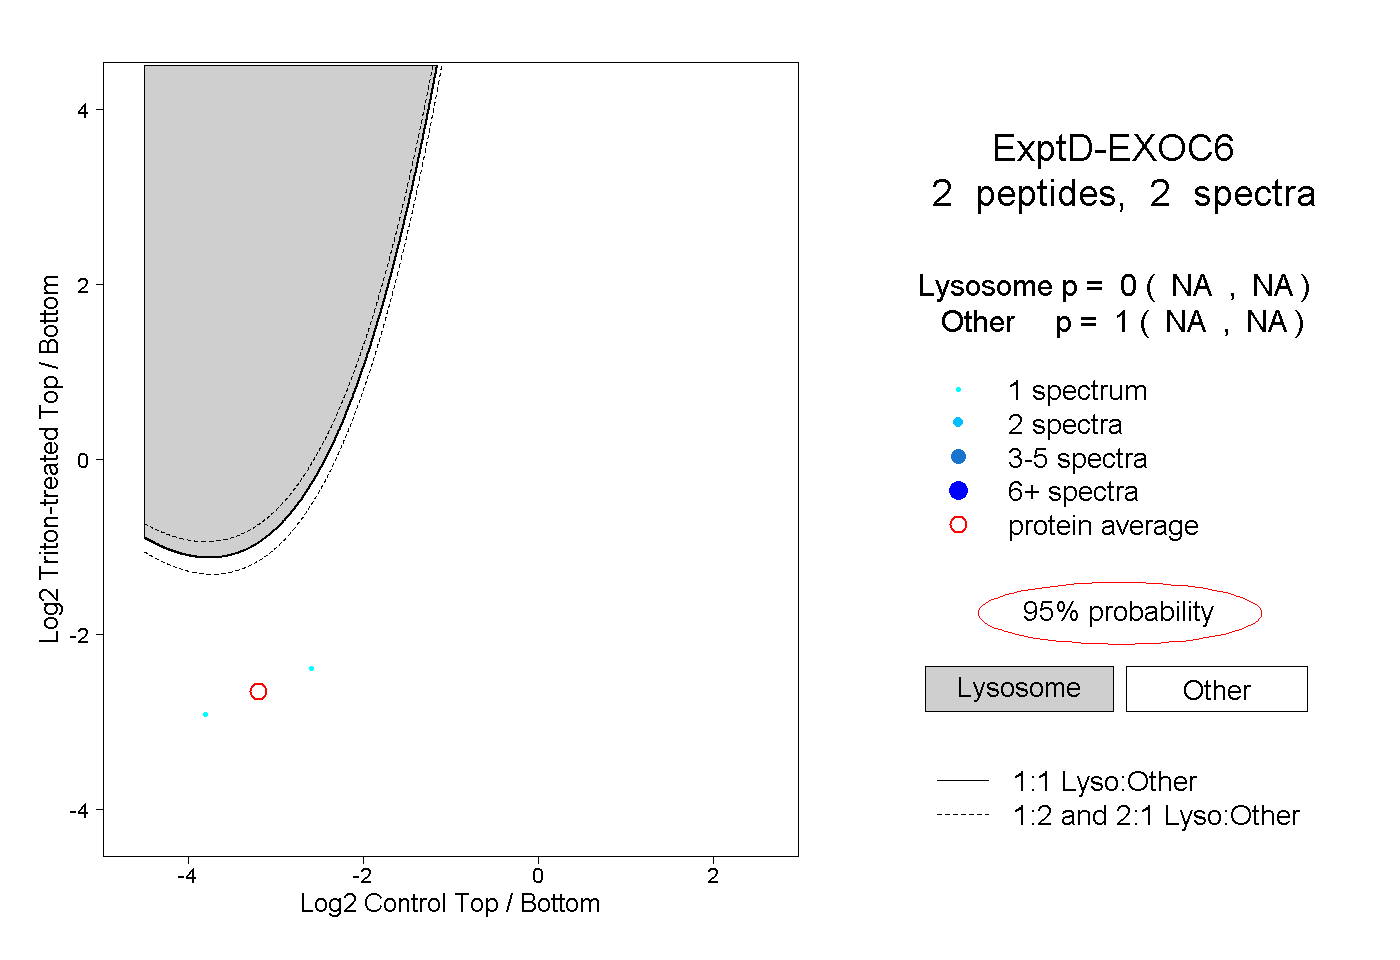
NA | NA
NA | NA